8 Debuggen
GDB Quickref für ES2: Link
GDB-Übung mit Aufgaben https://gitlab.com/hhoegl-tha/es/f446/gdb-uebung
8.1 OpenOCD
XXX to do (stammt auf prog.md)
Abbildung 8.1 shows the basic debug setup. The GNU Debugger for ARM connects to the OpenOCD via a local network connection on port number 3333. The OpenOCD server drives the debug adaptor.
OpenOCD also offers a telnet port as a command interface. Run the telnet command as telnet localhost 4444 and see the telnet prompt >. Type help to see all the available commands.
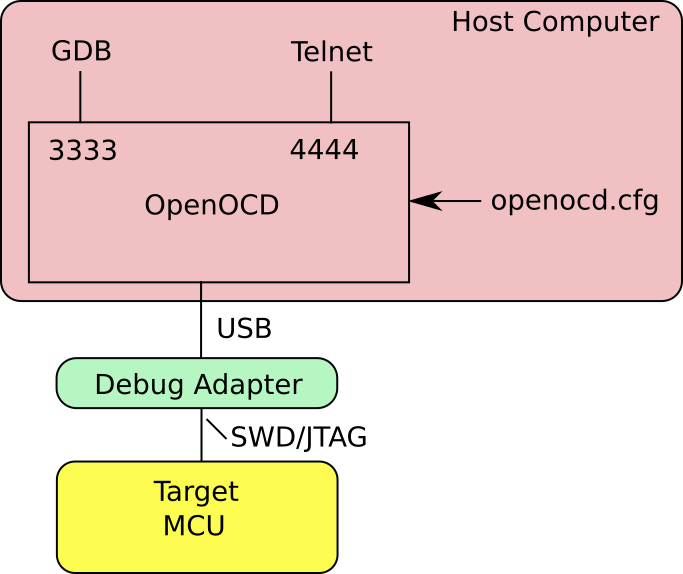
Simplified block diagram of the debug setup.
The OpenOCD homepage is http://openocd.org.
OpenOCD User’s Guide http://openocd.org/doc-release/html/index.html.
Important:
Each project makefile has a target
gdb. This target starts GDB with the configuration file.estool/gdbinit.GDB shows the source code after the file has been flashed into the microcontroller (or transferred into the RAM). Your can run the command
estool -f main.binoutside of GDB or runloadwithin GDB.If the GDB command window is blocked, the program runs on the target. You can stop the program by pressing Ctrl-C. Now you can enter GDB commands after the prompt
(arm-gdb).GDB has tab completion.
GDB and OpenOCD work only as long as the Nucleo board is connected to the USB. After plugging the board off and on, you must restart the OpenOCD and GDB.
8.2 GDB
Alle Demo-Projekte enthalten eine GDB Startup Datei .estool/gdbinit.
GDB immer im “Text User Interface” Modus starten (Option --tui, siehe Makefile).
GDB vervollständigt viele Eingaben durch Drücken der Tablulator Taste. Jedes Kommando kann verkürzt eingegeben werden, solange es eindeutig ist. Zum Beispiel br oder b statt breakpoint.
In GDB bekommt man einen Hilfetext durch das help Kommando:
(arm-gdb) help breakpointBreakpoints ausgeben::
(arm-gdb) info br
Num     Type           Disp Enb Address    What
1       breakpoint     keep y   0x0800015e in main at main.c:47
Breakpoints kann man löschen mit del <Num>. Man kann sie auch
deaktivieren/aktivieren mit disable <Num> und enable <Num>. Mit cont führt man das Programm bis zum nächsten Breakpoint (oder bis zum Programmende) aus.
Breakpoint z.B. auf Funktion toggle_led() setzen: br toggle_leds. Die Funktionsnamen vervollständigt GDB durch die TAB Taste. Man kann auch Zeilennummern verwenden, z.B. br 192.
Variablen ausgeben mit p <variable>.
Lokale Variable ausgeben mit <Funktion>::<Variable>:
(arm-gdb) p main::loopcnt
$2 = 0x4e
Adressen von globalen Variablen ausgeben am Beispiel von globvar:
(arm-gdb) p &globvar
$1 = (int *) 0x2000000c <globvar>
Anregung: Definieren Sie Variablen in unterschiedlichen Speicherabschnitten und finden Sie die Adressen:
int g_bss;
int g_data = 4;
uint8_t g_array[] = {2, 14, 29, 7, 0};
const int g_cdata = 5;
Ordnen Sie die gefundenen Adressen in die Abschnitte des Linker-Scripts ein. Schauen Sie sich in diesem Zusammenhang auch das GCC Werkeug arm-none-eabi-nm an. Es findet Adressen in ausführbaren Programmen.
Displays. Man kann sich mit display Variablen und Register
automatisch nach jedem Breakpoint anzeigen lassen:
br 192
display hADCxConvertedData_Temperature_DegreeCelsius
Ein Display löscht man wieder mit dem undisplay Kommando.
Ausgeben des Speichers (“memory dump”). Die Variable g_data hat den Wert 4. Aufpassen: Das Kommando x/1xw g_data interpretiert den Wert von g_data als Adresse auf den Speicher! Der meist gewünschte Output wird erst durch x/1xw &g_data erreicht.
(arm-gdb) x/1xw g_data
0x4:    0x080001c5
(arm-gdb) x/1xw &g_data
0x20000000 <g_data>:    0x00000004
Geben Sie alle Elemente von g_array aus. Dazu müssen Sie das
Kommando x modifizieren, eine Hilfe bekommen Sie durch
(arm-gdb) help x.
Variable auf neuen Wert setzen:
(arm-gdb) set var g_bss = 21GDB “Oberfläche” auf mehrere Fenster umschalten, in denen der C Quelltext, die Assemblerbefehle und die Kommandos stehen:
(arm-gdb) C-x 2Die Angabe C-x 2 bedeutet: zunächst Steuerung-x drücken, Finger weg, dann die 2 drücken. Mehrfaches C-x 2 schaltet verschiedene Ansichten durch. Mit C-x o kann man den Fokus nacheinander auf jedes Fenster legen.
Programm wieder von Anfang an ausführen:
(arm-gdb) monitor reset halt
(arm-gdb) continue
In gdbinit gibt es dazu das selbst definierte Kommando debug-program.
Watchpoints unterbrechen den Programmablauf, wenn eine Variable geschrieben oder gelesen wird:
(arm-gdb) watch hADCxConvertedData_Temperature_DegreeCelsiusKommandos mit Breakpoints verknüpfen. Das folgende Beispiel legt ein print Kommando für den Breakpoint Nr. 5 an. Es können auch mehrere Kommandos vor dem end aufgenommen werden. Nach jedem Breakpoint Nr. 5 wird die Kommando-Liste abgearbeitet.
commands 5
p hADCxConvertedData_Temperature_DegreeCelsius
end
Bedingter Breakpoint
(arm-gdb) br 192 if hADCxConvertedData_Temperature_DegreeCelsius == 19Bedingter Breakpoint, zusätzlich mit Kommandoliste:
set $tmp = hADCxConvertedData_Temperature_DegreeCelsius
b 192 if $tmp != hADCxConvertedData_Temperature_DegreeCelsius
commands
set $tmp = hADCxConvertedData_Temperature_DegreeCelsius
p hADCxConvertedData_Temperature_DegreeCelsius
continue
end
GDB Kommandos lassen sich in eine Textdatei schreiben und auf dem GDB Prompt mit source ausführen, z.B.
(arm-gdb) source gdbcmdDie Datei mit den Kommandos heisst hier gdbcmd, sie kann einen beliebigen Namen haben.
Liste von GDB Kommandos
XXX to do EN -> DE
Get help with
(arm-gdb) help ...Stop a running program with
Ctrl-C.Run program from start (also see GDB function
debug-programin.estool/gdbinit):(arm-gdb) monitor reset halt (arm-gdb) continueList breakpoints. Shows a number for each breakpoint.
(arm-gdb) info brSet breakpoint
(arm-gdb) b main
(arm-gdb) b RESET_Handler
Set breakpoint with command list
(arm-gdb) b RESET_Handler
(arm-gdb) commands
(arm-gdb) print $sp
(arm-gdb) continue
(arm-gdb) end
Delete breakpoint
(arm-gdb) del <nr>Similar command:
clearBreakpoint with condition
(arm-gdb) br handler if count == 10It is also possible to use the
conditioncommand.Step
Step one line or one instruction (
si). Steps into functions.(arm-gdb) s (arm-gdb) siNext
Next line or next instruction (
ni). Does not step into funtions.(arm-gdb) n (arm-gdb) niContinue
(arm-gdb) contFinish to the end of a function
(arm-gdb) finiPrint
(arm-gdb) p <expr>
(arm-gdb) p var1
(arm-gdb) p GPIOA_ODR
(arm-gdb) p EXTI->PR1
(arm-gdb) p &g_bss          # to find addresses also see arm-none-eabi-nm
(arm-gdb) p main::loopcnt   # local var
Dump memory
(arm-gdb) x <addr>
(arm-gdb) x/4xw 0
(arm-gdb) x/8xw $sp
Display
(arm-gdb) disp $spUse
undisplayto remove displays.Set variables
(arm-gdb) set var counter = 21Write value at an address
(arm-gdb) set *(uint32_t*)0x20002000 = 0x12345678Switch windows: repeat
C-x 2- Cmd, Src, Asm
- Cmd, Src, Reg
- Cmd, Asm, Reg
Set SP and PC
The following commands set stack pointer (SP) and program counter (PC). Then the program is startet (continue).
(arm-gdb) set $sp = 0x...
(arm-gdb) set $pc = 0x..
(arm-gdb) continue
The following commands are sometimes useful:
Erase Flash memory:
OpenOCD Telnet prompt:
> reset halt
> stm32l4x mass_erase 0
GDB console:
(arm-gdb) monitor reset halt
(arm-gdb) monitor stm32l4x mass_erase 0
Read and set the VTOR register in SCB (Vector Table Offset Register). This register is set to 0x00000000 after RESET.
(arm-gdb) x/1xw 0xE000ED08    # print VTOR register

(arm-gdb) monitor mww 0xE000ED08 0x20000000  # set VTOR to RAM (OpenOCD syntax)

(arm-gdb) set {int}0xE000ED08 = 0x20000000   # set VTOR to RAM (GDB syntax)
Print out the status register xPSR in a more readable form
You can define the following function in the .estool/gdbinit file:
define flags
printf "N=%d Z=%d C=%d V=%d Q=%d GE=%1x ICI/IT=0x%x Exc#=%d\n", \
($xPSR & 0x80000000)?1:0, \
($xPSR & 0x40000000)?1:0, \
($xPSR & 0x20000000)?1:0, \
($xPSR & 0x10000000)?1:0, \
($xPSR & 0x08000000)?1:0, \
($xPSR & 0x000F0000) >> 16, \
($xPSR & 0x0000FC00) >> 10, \
($xPSR & 0x000001FF)
end

document flags
Print out the xPSR register in a readable form
end
With this function you will have a nice printout of the flags in xPSR:
(arm-gdb) flags
N=0 Z=0 C=1 V=0 Q=0 GE=0 ICI/IT=0x0 Exc#=56
The p/x $xPSR will just print out:
(arm-gdb) p/x $xPSR
$2 = 0x21000038