This page is actually a collection of articles – all written by me
– about usage and benefits of telemetry with data logging.
The first article followed from a discussion about a battery's internal
resistance and an unexpected idea how to derive it from telemetry data.
Two other articles have been developed from investigations of incidents
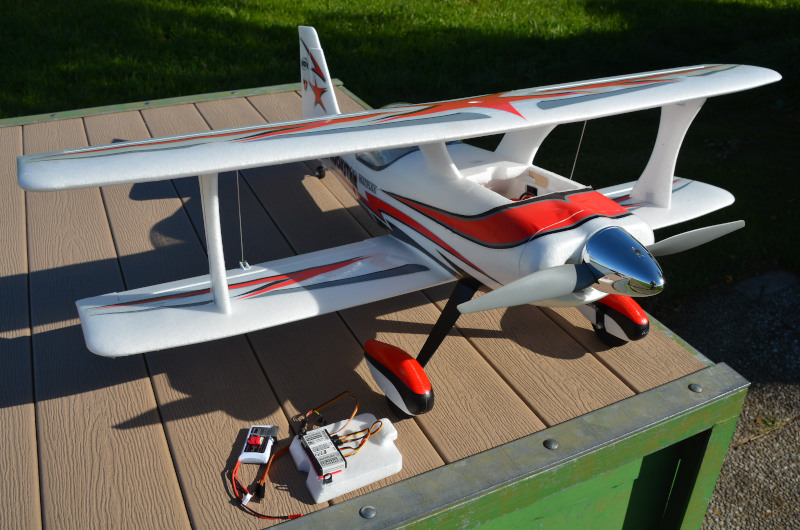
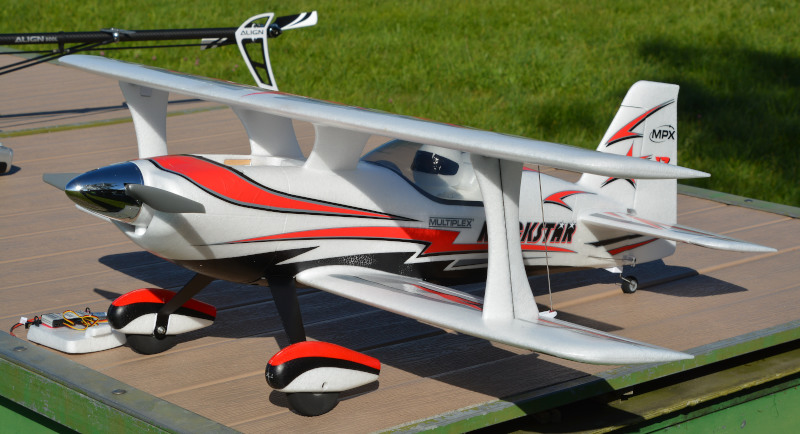
that happened to my Senior Telemaster Plus model airplane.
The dedicated review page has comprehensive information about
its telemetry equipment including setup.
Yet another article followed from a forum post for which special equipment
was put in another airplane model.
While all of these articles are based on data from my model airplanes
(see here
for a helicopter example) they yet address aspects of more general
significance – as indicated by their titles:
Internal Resistance Calculated from Telemetry Data
This article has been published in the
January 2018 issue of Ken Myers' Ampeer
Newsletter.
Later it has been edited for better readability and clearer reasoning;
a new introduction and an interesting aside have been added. This
is the revised edition:
The significance of knowing a drive battery's actual Internal
Resistance (IR) has been thoroughly discussed in the
September (part 1) and
October (part 2) 2017 issues of Ken Myers'
Ampeer Newsletter. Even better, several methods of measuring
have been tested for their feasibility and usefulness. It turned out
that none of them is easy or even conclusive. After the basic method
of calculating IR had been discussed in part 2, it dawned on me
that I might have an easy way to do it without extra equipment. In
some of my models, battery voltage and amperage are measured and
recorded in-flight by telemetry. Just an abrupt change in power
setting, preferably from idle to full, would be needed to show
the voltage drop caused by IR.
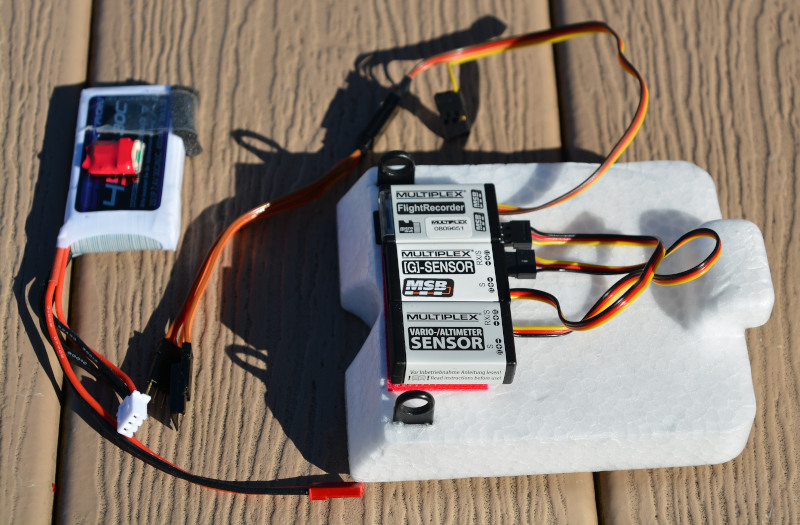
Data
There was an appropriate flight of
my Senior Telemaster Plus, done
to test the WingStabi flight stabilizer in light thermal conditions.
The model is loaded with telemetry and all data are recorded during
the flight so they can be analyzed later. The recorder (writing a .csv
file to a MicroSD card) is even in the airplane for more resolution or
precision, respectively. It could be in the transmitter as well, albeit
with ten times lower time-wise resolution, which might be still sufficient
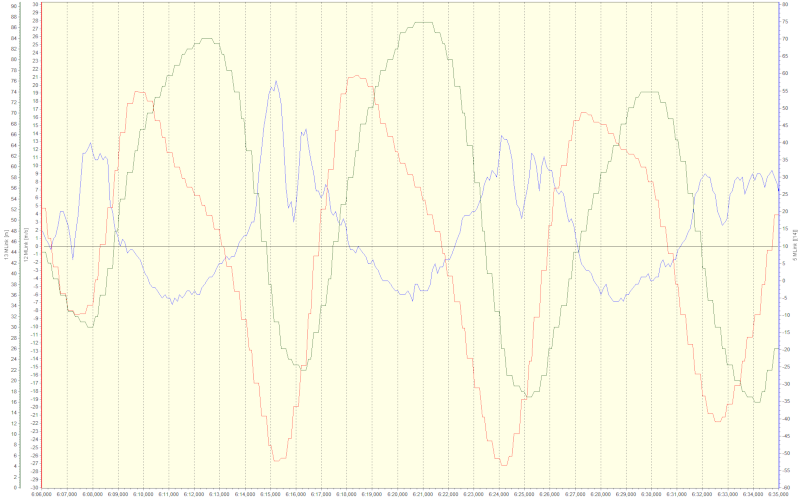
though. Anyway, in the following diagram, the drive battery's voltage
(magenta), amperage (red), and remaining charge (green) are plotted
over the time since telemetry run-up:
Drive battery voltage (magenta), amperage (red), and remaining charge
(green) over time since telemetry run-up.
Larger…
The (red) amperage line shows spikes for take-off at about 5:40
(5 minutes 40 seconds) and initial climb (shortly interrupted),
for a second climb at about 8:20, and a third climb at about 17:10. All
of them have been done with full power setting and you see how much less
power is available from the battery after 13 minutes flight time or
even after 3 minutes.
The green line shows a quite continuous discharge over time, and it's
rather smooth compared to the serrated red amperage line because it's
accumulated amperage.
These are real-life data and you see many fluctuations in them –
what is typical. Of course, amperage varies most with power setting. It
drops still noticeably when the airplane gets faster and hence prop rpm
gets bigger, most typically in turns flown with too little up-elevator.
But the small fluctuations are just "natural" – in flight
as well as in the workshop. They remind us not to be too pedantic when
measuring and interpreting data.
The same holds for the (pink) voltage line even if in a different way.
The sensor's resolution is just 0.1 V and the line runs not continuously
but in 0.1 V steps. It starts at 16.6 V before take-off and goes
down to 14.6 V during the last full-power climb. Average cell voltage
is 3.65 V then, and lowest cell-voltage (for clarity not shown in this
diagram) oscillates between 3.7 and 3.6 V due to sensor resolution,
what is actually 3.65 V as well.
There is still no weak cell showing up in the four-cell battery; after
all even a weak cell's voltage drop would not be noticeable that early
(with so much charge remaining, about 50%).
By the way, the 0.1 V sensor resolution is the reason why I've set
a 3.4 V warning level even though 3.3 V would be the actual
critical voltage but then a too low warning level.
Calculation
Despite the low voltage-resolution I just tried to derive the IR value;
after all the two climbs during the flight lend themselves as measuring
points: Amperage is increased by a significant amount so voltage drops
by even four or five 0.1 V steps, all in a quite short time. (That
is the total four-cell battery voltage – more cells would be even
better; lowest cell-voltage is impractical because it drops by only one
0.1 V step.)
Amperage is not zero before the climb, but it's reasonably continuous,
at least compared to the big peak value. So its increase could be even
bigger and there is no "stabilized open-circuit voltage"
as a point of reference; but throttle could have been closed for a while
– letting the model glide – if measuring IR would have been
the flight's purpose.
Fluctuations are evened out by taking an average over a few seconds
before and after power is increased, respectively. Since both points
are full-power measurements but the battery's state of charge is quite
different, we can't draw a single line for V over A. But we can draw
two of them and their slopes – that is IR values – should
be very similar. The following screenshot of a simple spreadsheet
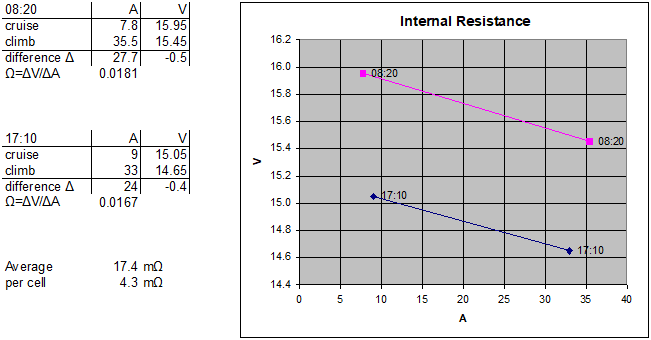
shows just that:
The two small tables on the left side enclose the voltage and amperage
values I took from the diagram above, one each during the respective
"cruise" flight immediately before the climb and during the
"climb". The labels "08:20" and "17:10"
stand for the points on the time axis where the data have been taken
from.
The voltage difference ("before/after" setting full power)
is divided by the amperage difference, giving the line slope –
that is the Internal Resistance IR in Ω (Ohm). The diagram on
the right side is just an illustration – the two lines are
pretty parallel.
So the two cases are quite close to each other: 0.0181 Ω,
or 18.1 mΩ (milliOhm), and 0.0167 Ω
(16.7 mΩ) differ from each other by about 8%. And
17.4 mΩ average (about 4.3 mΩ per cell) seems
to be a quite reasonable estimate for a 4S 5000mAh 30C LiPo battery.
(Follow-up: My new charger says 22 mΩ when charging and
20 mΩ when discharging an equal replacement battery.)
Of course, we have to take into account that the measured voltage and
amperage values are not quite accurate because our telemetry is not
exactly a precision instrument. Precision can be enhanced because
we have a whole diagram of values and can take reasonable averages
from the jaggy lines. But IR varies with depth of discharge (rises)
and temperature (falls) and it's hard to factor this in. Averaging
the two measurements is only a feeble attempt.
Assessment
High precision is not really necessary, though. It would be if I
wouldn't have telemetry with cell-voltage sensor and recorder and
could just measure the total battery IR in the workshop. My basic
assumption is that battery cells are not created equal (and not
assorted to equals in a pack), and an increasing IR is an idicator
of their aging. There are "weak" cells in a pack which
will age sooner and hence limit the whole battery's capacity and
service life (kind of the weakest link in a chain). But one weak
cell in a pack will become apparent only by a small increase of
total IR. So it would be easier (preciser, clearer) to measure
the IR of each cell in a pack through the balancer connector.
(I don't know if it would stand the amperage, though.)
Then again, the telemetry voltage sensor just measures lowest
cell-voltage under load, which is an alternative to IR (soared IR
reduces voltage and amperage). Directly taking the voltage as an
indicator (instead of the indirectly calculated IR) is even a
real-life and real-time measurement. Amperage pulsed by the ESC
in flight might be more significant than artificial DC load in
the workshop. The 0.1 V resolution steps are not too bad
if – as shown above – averages over a few seconds
are taken from recorded values and at least two measurements
are taken.
Quite generally, a recorder enhances telemetry's usefulness. Only
one recorder is needed, which can be put into different models or
even into the transmitter. Still it's useful only for those who
need or want that much telemetry. The average flyer would well do
without recorder, just with the voltage (and preferably amperage)
sensor. He'd still notice if and when a battery deteriorates what
is evidenced by at least one cell having lower capacity and dropping
voltage earlier than the other ones. (See next article below for
how that works out.)
Aside
There is an interesting aside: Knowing Internal Resistance lets
us calculate the heating power in the battery.
Power in W (Watt) is voltage times amperage. Voltage "lost"
by IR is amperage times IR. So heating power is amperage squared times
IR. In the case at hand (4S 5000mAh 30C LiPo, 17.4 mΩ IR),
35 A full-power amperage makes for 21.3 W heating power in
the battery – only 14% of all electrical losses in the drive.
But the heat can't flow out of the compact battery pack really fast,
not even with forced-cooling measures, which act only on the pack's
surface. So the pack's temperature rises, but – in this low-power
case – merely by 11°F in mixed flight (as measured by telemetry).
Battery warming is quite familiar to all of us, but the modern LiPo
batteries don't get really hot so we don't think about it like we
did before with the "good old" NiCd batteries. These got
quite hot when nearly discharged, and they have been discharged
routinely without bad consequences (and even intentionally to avoid
memory effect). Back then we knew that IR and hence temperature rise
at the end of the discharge cycle, and that a battery deteriorates
when it's hotter than before after a normal flight. We could even
touch each cell and feel how hot it gets when the battery was recharged.
That way we found out a weak cell and the battery's degraded capacity,
which let us lower the flight time warning in the transmitter. It was
all more or less experience, but it worked.
Today we don't completely discharge (and even charge) LiPo batteries
in order to give them a reasonable service life. Their IR and hence
their heat production is low, anyway, so perceived temperature is no
clear indication and we can't feel a single cell's temperature either.
We do want to know the battery's temperature for other reasons,
though: it would "boil" over 140°F and "freeze"
below 32°F. Both limits are tricky to feel by hand, so if drive
power is hot or ambient temperature low, we need some means to
measure it. Of course, telemetry lends itself to that. We need
telemetry all the more – but now for voltage and amperage
– just because temperature is no longer a clear indicator
of the battery's and its cells' health (or age) and we don't have
any indication to adjust the flight time warning (throttle timer).
Electric Drive Telemetry and LiPo Battery Failure
This article has been published in the
December 2018 issue of Ken Myers' Ampeer
Newsletter.
Later it has been edited for better readability and clearer reasoning;
another diagram and some discussion of uncertainties have been
inserted into the text, and postscripts have been added.
This is the revised edition:
We don’t completely discharge – and even charge –
modern LiPo drive batteries in order to give them a reasonable
service life. We can afford that because their specific energy
content (Watt-hours per ounce) is about four times that of the old
NiCd batteries. While the charger reliably limits the charge, we may
feel unsure about the actual discharge during flights, which can be
quite different in their power demand after all.
What helps is a telemetry amperage sensor that is able to add up any
battery drain and subtract it from a preset capacity. This is aptly
called a "fuel gauge for the battery". I for one limit
charge to 4.18 V per cell. That means about 3% less capacity
than fully charged to 4.20 V. Hence I have set 4850 (97%)
instead of 5000 mAh (100%) capacity for the telemetry discharge
counter. The low-charge warning level was initially set to 25% or
1250 mAh to be warned in time to land the model before the safe
20% discharge limit (1000 mAh) is reached.
Now these are all nominal values, not necessarily real ones. It is
not uncommon that even a new battery’s real capacity is lower
than specified. In any case, capacity lessens as the battery gets
older, no matter if it’s used or just stored. And it may lose
capacity by maltreatment like deep discharge. Hence these telemetry
parameters have to be adjusted –
after the first flights with a new battery, then regularly, after any
mishap, and towards the end of the battery’s service life.
Incidentally, that could make it difficult to use several batteries
in turn in the same model, but I don’t do that.
Besides, the higher the amperage drawn from the battery is, the lower
is its real capacity. Again, it’s not uncommon that nominal
capacity is specified for only 1C amperage. So a lower real capacity
has to be set in telemetry to count down from, and this value should
be adequate to an average flight’s amperage. Otherwise,
rather the low-charge warning level could be set differently –
higher for flights with high amperage load and lower for more
leisurely flights. My flights are not that different, though.
Beyond discharge count, there is even a fair chance to detect
capacity degradation or just variation in flight. The battery would
drop voltage prematurely, so we may want a telemetry voltage sensor
in addition. For a new battery with fresh cells, total voltage may be
indicative enough of its health. But because some cells in a pack age
faster than others, such a sensor should ideally (additionally)
find the weakest cell and report its voltage. That seems to be
useful when the battery gets old or worn out, and if there are
substantially different flight regimes.
With telemetry, we try to protect our delicate LiPo batteries
and yet get the most out of them. But how does this work out
in practice? Here’s what I think is a typical example:
Damage
In October 2016, total battery voltage, amperage, and charge
sensors (all in the ESC) were
in my Senior Telemaster Plus when I made
a mistake. I won’t discuss the gory details (more in the
next article below) but rather what
telemetry could help (or not) in that situation. The following
diagram shows battery voltage (magenta), amperage (red), and
charge (green), as well as the airplane’s altitude (blue, from
a GPS) over a whole practice flight. The horizontal axis shows minutes
and seconds (separated by a colon) since telemetry run-up. Decimal
point and thousands separator are interchanged on the vertical axes
(German formatting).
Drive battery voltage (magenta), amperage (red), charge (green),
and GPS altitude (blue) over the whole flight.
Larger…
The peaks in the (red) amperage and (blue) altitude lines indicate
traffic
patterns. In the 23rd take-off things went awry.
The (magenta) voltage as well as the (red) amperage line show the
battery’s discharge curve quite well, I mean how voltage drops
fast in the beginning, then only slowly, until it drops
progressively in the end. That’s a clear indication of my fault
already since a LiPo battery should never be discharged that deep.
Detail diagram showing the last seven traffic patterns,
the incident, and almost a minute after it.
Larger…
I missed the low-charge warning for 1250 mAh (25%) remaining
charge at about 32:05, just at the end of a climb. Two take-offs
later, the recommended 1000 mAh (20%) discharge limit was
under-run at 33:35. Another two take-offs later, the 4 x 3.4 = 13.6 V
low-voltage warning level was under-run at about 35:10. Here's
where voltage started to drop rapidly and amperage as a result (so the
level is set appropriately).
The safe 3.3 V cell voltage limit was under-run at 36:00 in
the next take-off, but yet the next landing was done at 36:50 without
reaching the critical 3.2 V cell voltage limit. Remaining
charge was 590 mAh (11.8%) or 410 mAh (8.2%), respectively.
It’s not that I’m just a scatterbrained geezer. I even
managed to set up the telemetry correctly (and it worked correctly)
but I messed up the voice output. The low-charge alarm was mistakenly
set to permanent, meaning it was permanently voiced, and there were
even other announcements interspersed. Hence the voice output was
cluttered beyond recognition and I had to learn the hard way why
restricting announcements to a minimum is a good idea.
Small detail diagram showing the last complete traffic pattern,
the incident (center), and almost a minute after it.
larger…
An interesting aside is that the (red) amperage line’s
“hump” in this diagram’s center shows three
ESC features:
Its inclined right part results from low-voltage power reduction
to keep voltage up at 12.8 V, as evidenced by the (magenta) voltage
line’s level part over it.
Its steeply – but not vertically – rising left and falling
right edges are due to “soft” motor run-up and
braking, respectively.
That holds for the other red-line “humps” as well,
especially the one leftmost.
While it’s a full-power “hump”, the next one (to the right)
shows even “softer” run-up and braking, which take just as long or
even longer now but to or from only half-power, respectively. That
seems to be a fourth ESC
feature as it’s seen in the rest of the flight as well.
Still there was another safety feature:
the ESC was set to
low-voltage “power reduction” (instead of “cut-off”).
This is meant to save the battery and yet avoid a surprising dead-stick
(cut-off) in case of deep discharge.
As a matter of course, it set in during the next take-off run (at 36:55)
when full power was set. It reduced power continuously and just enough to
keep voltage up, but that made a proper climb after take-off impossible,
not to mention a go-around. Finally I cut power (the rest of it)
when the model touched a bush top (at 37:04). There was still 335 mAh
(6.7%) charge left.
Obviously, the low-voltage trigger level is pre-set (not adjustable)
to the critical 3.2 V per cell, that is 12.8 V for
the 4S battery. This level was slightly under-run to 12.7 V and
even 12.6 V for a split-second so average (let alone lowest)
cell voltage was 3.175 V or 3.15 V, respectively – too
low. Without any load (amperage), it recovered to only 3.325 V
(13.3 V total, see diagram) whereas it should have reached
3.75 V (15.0 V total) again, minimum idle voltage of a healthy
battery. Obviously, even the small shortfall in voltage and the associated
deep discharge hurt the battery. It was swollen (puffed-up) thereafter and
had noticeably less capacity.
Failure
In September 2018, there was even a cell-voltage sensor
in my Senior Telemaster Plus.
I had raised the low-charge warning level to 1500 mAh (30%)
because the battery had lost capacity. The following diagram shows
the battery’s final flight. The 4S-battery voltage (magenta)
and lowest cell-voltage (blue) axes are scaled 4:1 so both lines
are overlaid. Since both sensors have 0.1 V resolution the
cell-voltage line has four times bigger steps. The two lines
coincide fairly well until about 21:00 when a fatal
incidence occurred: cell failure.
Battery voltage (magenta), cell voltage (cyan), charge (green),
amperage (brown), barometric altitude (pink).
Larger…
The (green) charge line is still rather high (nearly 30% remaining
nominally) at the time of incidence. Altitude (pink) and amperage
(brown) lines show an initial full-power climb to thermal altitude
(at 2:30). Then, more or less (or even zero) power was set while the
airplane loitered in thermals and downdrafts. Power was cut (at
19:20) after the 1500 mAh (30%) low-charge warning had been
announced. Setting it to even 1650 mAh (33%) at the least might
have prevented the incidence.
In retrospect (looking at the diagram), there was even
a sign of the coming cell failure: There are two short drops of cell
voltage (blue, at 18:42 and 19:04), but only by 0.1 V to still
3.6 V – well above the 3.4 V warning level. Battery
voltage (magenta) didn’t even drop and recovered by 0.2 V
after power had been cut while (lowest) cell voltage remained low.
Even taking the 0.1 V sensor resolution and the 4:1 scaling into
account, this means one cell was about to fail, but just the fact
that it dropped voltage – not the amount – hinted
at that. Hence it was not perceptible.
It’s possible that I coincidentally reduced power just at the
moment when cell voltage dropped, for instance because I realized
that the airplane had gained good altitude in another thermal. My
recollection is clouded by the following events so a log of the ESC
settings during the flight would be needed to clear that up.
Regardless, the interesting question is whether there could have been
another, perceptible sign of the coming cell failure. To answer it,
let’s just assume that amperage dropped permanently due to
increased internal resistance even after the first short voltage
drop.
Detail diagram showing the last thermal circles, the turn back
to the field, the fast descent, and the tree-landing.
Larger…
However, there was still no way to notice that. This detail
diagram shows no clear amperage drop from 18:45 on – like the
full diagram above – but just the usual fluctuations at a slightly
lower level. And I had expected that the battery would recuperate while
power was cut, but there was hardly any power when needed to fly over
a row of trees. I rather cut power when the airplane was blown by winds
gusting up to 15 mph or even 20 mph, and then sunk into a tree.
At least that’s what I think I did; I have no clear recollection
because I was so stunned. Anyway, battery voltage remained well above
the ESC’s 12.8 V power-reduction trigger level.
Small detail diagram showing the final approach and the leap
over the tree where one battery cell failed.
Larger…
It happened in quite a short time, even seen in the 30 seconds time
frame from 20:40 to 21:10 shown in this detail diagram. When some
amperage was drawn from the battery (at about 20:57), its voltage
dropped from 14.8 V to 14.0 V – by 0.8 V –
while the lowest cell voltage dropped from 3.7 V to 2.8 V
– by 0.9 V. The voltage drops are not equal (mind the
0.1 V resolution) and not exactly synchronous either.
Oddly enough, battery voltage recovered to 14.9 V and even the
bad cell recovered to 3.7 V what is still close to minimum idle
voltage (3.75 V). But the charge left in the battery (green)
was nominally 1436 mAh (28.7%), substantially more than 1000 mAh
(20%) when the battery was new – it had lost capacity. It had
been used for less than 100 flights yet it was 3½ years old
and had suffered the deep discharge two years before. The loss of
capacity had been noticeable when re-charging it.
Comparison
The two flights are quite different in their course but overall
drive usage is still quite similar: For a minor part of the
flight duration, full power is set for climb (to traffic pattern
altitude or to thermal altitude). For the major part, more
or less cruise power is used (for traffic patterns or in search
of thermals). For another minor part, power is low or even off
(approaches, descents, thermalling).
The first flight lasted 29:45 and 4515 mAh were used up; 19:20
and 3415 mAh in the second flight. That were 152 mAh/min
and 177 mAh/min, respectively, so battery drain in the first
flight was 86% of that in the second one. If idle times (4:35 and
2:30, respectively) are excluded (what the throttle timer
does), the battery drains were 179 mAh/min and 203 mAh/min,
respectively. Their ratio is now even 88%.
The first flight’s lower battery drain might be due to the
quite big amount of landing approaches. Then again, the second
flight’s higher battery drain might be due to the quite big
amount of downdrafts. Either way, differences in battery drain seem
to be just random. The 200 mAh/min or 20 minutes flight
time rule-of-thumb gained by experience seems to be on the safe side.
Conclusions
Does telemetry help taking care of the drive battery?
Actually it did help avoiding deep discharge, I just hadn’t
properly set up the voice output and didn’t pay attention to it.
But once the battery was flawed and aged, telemetry was not able to predict
that it would suddenly fail without warning, what might be a LiPo characteristic.
There should have been a really generous safety margin in the low-charge
warning level or – even better – the battery should
have been scrapped in good time in advance.
Is the ESC’s low-voltage power reduction a substitute?
To be one, it would have to set in earlier, at 3.3 V cell voltage
at the least, and then it would need voice output to alert me of the
coming power reduction – that’s what telemetry does already.
Moreover, it enforces power reduction in order to save the battery
(what actually failed because the 3.2 V cut-off level is too low)
and thereby deprives me of the option to sacrifice the battery in order
to save the model. I prefer telemetry and don’t see it as a
complement, either. I even wish I could deactivate it altogether.
Is telemetry worth it?
Well yes, it has its value and it’s not really expensive either,
but that seems to be a pointless question nowadays. Likewise, if I’d
be asked if I need my smartphone I’d say actually not –
I just have it.
What if there’s no way to have telemetry in a model for some reason?
The traditional throttle timer seems to be still good enough for all
practical purposes. Battery drain is surprisingly constant with my model,
nearly independent of the course of flight. Just a bit more safety margin
would be needed compared to telemetry, maybe 15% at most.
This exemplary investigation of ill-fated flights was possible because
a recorder in the airplane logged all telemetry data ten times a
second and a GPS’s position data twice a second. That’s
an almost complete “black box” system for models, lacking just
servo movements. Especially the power settings (on the ESC’s
channel) would be badly needed to clear up doubts about what really
happened.
Postscript (short)
Some people hold the view that a swollen (puffed up) LiPo battery is
clearly damaged and should be disposed of (for instance see
here).
This seems to be vindicated by the sequence of incidents investigated here,
even though another hazard showed up that is usually not mentioned in those articles.
At any rate, close inspection of the logged telemetry data would have timely
revealed a damaged LiPo battery. So if that simple rule of disposal seems
too radical, logging and evaluating telemetry data may provide inescapable
facts. These are valuable since even unforeseen consequences are no longer
inescapable then. The damaged battery did not torch my car or even
house, what I would have expected and prevented by means of a fire-resistant
case. I had just figured that it would gradually decay but not that it would
suddenly quit working. So unexpectedly risking the airplane was bad
enough. Sheer good luck saved me from losing a good $1500 model for a bad $75
battery.
Postscript (long)
The implicit assumptions underlying this article may be clear,
but just to be sure let’s make them explicit.
In the end, two important conclusions, which we omitted to draw
in the first place, will be explicit as well:
In all circumstances, a LiPo battery’s state of charge (SoC)
is expressed by its actual idle voltage, which is its voltage in the absence
of any – charge or discharge – amperage. That’s because
these voltages are invariable characteristics of the particular LiPo
chemistry.
The commonly accepted definition of full, or 100% charge
is 4.20 V per cell. Even though higher end-of-charge voltages are
possible, they would just shorten the battery’s service life too
much. Conversely, charging to lower voltages somewhat prolongs the
battery’s service life, but by definition it’s not fully
charged then, for instance only 97% at 4.18 V per cell.
The definition of complete discharge (0% charge) can
not be 0.00 V because that would mean a destroyed battery.
Instead, a so-called cut-off voltage is specified which is high enough
to avoid any damage to the battery. Common values are 2.50 V,
2.75 V, or – liberally – even 3.00 V per cell.
That’s not the value the ESC’s low-voltage
cut-off should be set to!
Discharging not below cut-off voltage (0% charge by definition) would yet
shorten the battery’s service life too much. It’s all-agreed
that discharge should stop at 20% charge at least and that more remaining
charge somewhat prolongs the battery’s service life. Discharging
below 20% is called deep discharge for discouragement.
A conservative value representing 20% charge is now 3.75 V (formerly
3.70 V) idle voltage per cell what is even a bit more than
the LiPo chemistry’s nominal voltage (3.70 V).
In flight, measuring idle voltage is not practical so voltage under load
must do. Due to the battery’s internal resistance (IR), any amperage
will make for proportionally lower terminal voltage (Ohm’s law).
Basically, the maximum allowable amperage (C-rating) of LiPo batteries is
inversely proportional to their internal resistance. Hence it’s
possible to specify a lower voltage-limit common to all LiPo batteries,
which was 3.20 V and is now a more conservative 3.30 V per cell
measured “under full load” (amperage).
But this is not only seen as representation of 20% charge but as well as
an absolute limit below which the battery may be damaged. So if and when
this limit was just reached no matter what amperage, then the battery
should still recover to at least 3.75 V idle voltage per cell
or it wouldn’t be deemed “healthy” any longer.
Typically, voltage sensors have 0.1 V resolution what may give reasons
for setting the ESC’s low-voltage cut-off to 3.30 V or –
more conservative – 3.40 V per cell. At least a telemetry
warning level should be set that high to be warned in time before the
battery will run out of charge.
So far, charge has been viewed as a percentage but it’s rather an
absolute value after all. The point is that the percentages are invariably
linked to the characteristic voltages while the absolute values vary.
Absolute charge is defined as an amperage in milliAmpere (mA) that
can be drawn from the battery for a certain time in hours (h), so its unit
is milliAmpere times hours (mAh). If, in this time, the battery’s idle
voltage would go down from 4.20 V (100%) to the cut-off voltage (0%),
this is called nominal capacity. In practice, it is only partially
usable due to the 20% discharge limit and possibly less-than-full
charging, for instance to only 97%.
In that case, only 77% of the nominal capacity would be usable and that
might be 3850 mAh from a 5000 mAh battery. But nominal
capacity may be specified based on 1C discharge amperage, that is for one
hour just numerically the same amperage as capacity (hence C): 5000 thousandth
Ampere (mA) or 5 A. Now if the battery is discharged at 6C (30 A)
in flight, full-discharge time will be not 1 hour divided by 6 (10
minutes) but even less. Put another way, capacity is lower than specified at
discharge rates (C-rates) higher than the C-rate underlying the
specification. Let’s just assume 10% less as an example, so our
battery’s nominal capacity would actually be only 4500 mAh
at 6C and usable capacity would be 77% of that: 3465 mAh.
All batteries behave this way, but some reputable suppliers even specify
nominal capacity for C-rates common in model airplane applications so we
can really draw 3850 mAh from a 5000 mAh battery. Still there
is another issue: Capacities are often specified for 70°F battery
temperature (21°C). At lower temperatures, internal resistance
is higher so the 3.30 V per cell low-voltage limit is reached at
lower C-rates and capacity is reduced substantially. Even at 50°F
(10°C), allowable amperage (C-rating) is reduced by more than 50%.
Because that could make flying with a cold battery virtually impossible,
an adapted specification for cold-weather flying would be pointless.
The technically correct solution to the problem would be pre-warming the
battery, best to 95 to 105°F (35 to 40°C, or body temperature).
But that is not practicable with a model like the Senior Telemaster, which
draws little more than 2C in cruise flight. The heating power in the battery
due to its internal resistance is barely 2.5 W then (see first article
above) and not enough to
compensate the cooling airstream. So the battery’s temperature will
inevitably fall and its capacity likewise. A high C-rating will help,
yet the telemetry discharge counter is rendered virtually useless. Only
a cell-voltage sensor can still provide a reliable discharge warning.
But let’s assume that ambient temperature is 70°F (21°C)
and that our 5000 mAh LiPo battery is really up to its specification.
Yet this latter condition will hold not for long since each and any battery
loses capacity over time. Often the number of (charge-and-discharge)
cycles is stated to be the most important factor of this aging,
storing the battery at more (or less) than half-charge and high (room)
temperature the next important, as well as re-charging or flying when
the battery is still hot. However, even just properly storing a battery
makes it lose capacity. A rule-of-thumb says a LiPo battery is finished
after 150 to 200 cycles or 3 to 5 years, respectively, give or take with
good or bad treatment. That’s why we would buy one new battery every
so often rather than several at once.
Every new battery will go through the aging process, just slower or
faster. The first cycles and the first time will make for more capacity
degradation than the following (degressive degradation). Let’s
assume that capacity is reduced by 10% after a while so there are only
4500 mAh left. We charge to 97% leaving only 4365 mAh.
Obviously, that’s the value a telemetry sensor would have to be set
to. Then it could add up any amperage draw in flight and subtract it from
this value to display the correct charge remaining in the battery. The
20% discharge limit would be reached at 900 mAh. Another way to
handle this degradation would be leaving the capacity value unchanged
(still 4850 mAh for 97%) but raising the discharge limit to
1400 mAh (28% of initial capacity).
Either way, to be on the safe side we should rather over-estimate the
degradation, which can’t be measured exactly, not even with a good
charger. In any case, the discharge warning level has to exceed the discharge
limit by an absolute amount of charge (for instance 250 mAh),
not by a percentage. This amount – as a reserve – should
be good for getting the model back to the runway in all circumstances.
One extreme case may be a touch-and-go landing with following full-power
climb and go-around, like in the first incident investigated here. Another
extreme case may be flying back against strong headwind from a far leeward
position, like in the second incident investigated here.
There may be little to no difference between the cells of a battery when
it’s new. But each cell has its own aging speed so their
capacities become different over time. Some “weaker” cells
will reach the 3.30 V low-voltage limit sooner in flight than the
others. Since the cells are connected in series, for instance four of
them (4S), the weakest cell determines, that is limits the whole
battery’s capacity. Its discharge limit can’t be detected
by an amperage (discharge) counter, though, because the same amperage
goes through all cells in series. The only way to find it out is by a
voltage sensor. A battery voltage sensor is easily “fooled”
because a weak cell’s low voltage is compensated by the stronger
cells’ high voltage in a multi-cell battery. Only a cell
voltage sensor, which separately accesses each cell via the balancer
connector, can definitely and hence safely detect when the discharge
limit is reached.
So even if the battery’s cells are different, or the
telemetry discharge counter is not adjusted to the battery’s
age, or amperage draw is unusually high, or the battery
is cold, a cell-voltage sensor could still reliably detect its
actual, instantaneous discharge limit. To have the aforementioned
reserve in these cases, the low-voltage warning level could be
raised to even 3.5 V. That should trigger an alarm at slightly more
than 25% (real, not nominal) remaining charge. Set to only 3.4 V,
it would trigger at merely about 15% charge, somewhat in the deep-discharge
range below 20%. These values may vary with more or less amperage draw. But
even a decent 7C (35 A) load makes for just 0.15 V cell voltage
drop (in our case of a 5000 mAh 30C battery) so there is not that much
variance (see first article above).
And because the voltage sensors have 0.1 V steps (resolution), no
intermediate values are possible and it’s a binary choice, anyway.
The most basic assumption was that a battery’s state of charge
is expressed by its actual idle voltage, or voltage under load as a
substitute. That would have really worked out in the first place, that
is in the first incident investigated here (even if there was no
cell-voltage sensor yet). The low-voltage warning level just
should have been higher. So electric drive telemetry can be deemed
useful at least as long as the battery is in good working order.
In the second incident investigated here, the basic assumption was
perhaps still valid even though the battery was aged and flawed. But
telemetry was not able to give a perceptible sign of the imminent cell
failure. So it was indeed no longer useful in this situation,
at least not to the former extent. Yet that does not detract from
telemetry’s general usefulness – we just didn’t
draw an important conclusion because it’s not directly related
to telemetry: An aged and flawed LiPo battery should be disposed of
rather sooner than later. It’s too risky and not worth it to
squeeze the last bit of service life out of it, like I did –
with unforeseen consequences. As a matter of course, if the battery
fails at all then it fails when it’s needed (loaded) the most,
so I should have known better.
Obviously, telemetry is not able to predict if and when a battery
will suddenly fail, much less the consequences. But if there’s
a data logger which records the in-flight data for later – routine
– evaluation, telemetry can even help monitoring the battery’s
“state of health”. This may provide indications of a
failure’s probability.
However, there’s at least one very simple and obvious sign of
a LiPo battery’s possibly bad health: when it’s swollen,
or puffed up. To be safe, we could just accept that it’s
finished then. That’s the other important conclusion we
omitted to draw.
Now that all assumptions and conclusions are explicit, a general
telemetry setup seems possible which can be maintained over the
battery’s whole service life. That saves the trouble
of adapting parameters multiple times and allows using several
batteries of different age in alternation. It’s based
on the understanding that precision is not necessary in monitoring
a flight battery’s state of health if and when generous safety
margins are provided. Still telemetry needs smaller safety margins than
the throttle timer because it reacts to varying amperage draw (provided
going easy on the battery is intended in both cases). Such a general
setup can be even safer since it’s less error-prone
(simpler, done only once) and is defined here for medium- and
low-performance applications (allowing good safety margins)
in the first place before it's adapted to high-performance
applications (allowing no safety margin at all) –
and helicopters (in between).
Medium performance is defined here as typically flying at 2.4C
on average, discharging a not fully charged battery to not less than 25%
of its nominal capacity, giving 17 minutes powered flight time after
all. That is still so much that we are able to afford discharging merely
up to 67% (that is ⅔) of the nominal capacity, what is called a
good safety margin here. This is the Senior Telemaster Plus case.
Low performance is defined here as flying at merely about 1C on
average, giving even 40 minutes powered flight time, all else the
same. This is the Brummi case.
In both cases, full power is rarely used, especially towards the end of
a flight, so battery voltage stays high and no warning is triggered. But
just in an emergency, which is more likely towards a flight’s end,
full power is needed and voltage drops far below the warning level –
too late, too much charge drawn already.
Hence the concept requires some form of an amperage sensor which is
able to add-up any amperage draw to a discharge value. There are
separate sensors, which are a bit clunky but can deliver additional maximum
and average values. It seems more natural – and maybe even cheaper –
to use an ESC with built-in
telemetry, which provides no averages but more useful values like ESC
temperature, ESC input voltage, and drive rotational speed (rpm).
Just as a complement, a cell-voltage sensor is added which is plugged
to the battery’s balancer connector. Hence it’s naturally a separate
device. It must monitor the lowest cell-voltage in the battery pack
and it may provide more features like battery voltage, safety checks,
and alarm suppression during short amperage bursts (for instance when abruptly
running up the motor).
Obviously, there have to be warning levels for the discharge
counter and for lowest cell-voltage (optionally for other
values as well). The discharge warning is the main means of advising the
pilot to land without excitement. Due to an ample safety margin in the
level, this prevents discharging below 25% in most of all circumstances.
Only in extreme cases, the voltage warning as a fallback prevents underrunning
at least 20%. Setting the discharge level requires some simple calculations
while the voltage level is set to a fixed value.
We just anticipate the battery’s age-relatedcapacitydegradation in a normal (150 to 200 cycles) service life. At least 10%
are deducted from real capacity at the usual amperage draw (C-rate). Because
C-rate is so low here, we may well take the nominal capacity for real. We assume
only 10% deduction here because we’re going easy on the battery by drawing
a low average C-rate and charging and discharging sparingly. (Assuming a deduction
for C-rate and more deduction for aging would increase safety.) Charging to only
4.18 V (less is not possible with my charger) reduces charge by about 3%.
Since these are all estimates, anyway, we may arbitrarily choose values between
10% and 20% or rather absolute values which are nice round numbers. For a
5000 mAh battery, 10%+3%=13% is 650 mAh and 4300 mAh may go
for a nice round number to be used in the capacity parameter.
The discharge warning level is based on the deepest discharge
we are prepared to tolerate. That should be 25% because that’s going easy
on the battery and because it can be detected by the cell-voltage sensor.
On top of this goes a generous reserve that is good for getting the
airplane back to the runway in all circumstances, typically 5% (good for
1¼ minutes at 2.4C). In our case, this would be 1250 mAh plus
250 mAh resulting in 1500 mAh as a quite nice round number, or 30% of
nominal capacity. In case the sensor simply adds up the amperage drawn from the
battery (and doesn’t subtract that from capacity), the warning level would be
calculated as 4300 mAh capacity minus 1500 mAh remaining charge, giving
2800 mAh accumulated draw, what is 56% of nominal capacity and also called
usable capacity. It’s still good for 14 minutes of normal
flying, approach and landing not even included, so we might trade a
couple of minutes for even more safety.
But this should be done by setting the throttle timer to fewer minutes
while adhering to the correct warning levels and thus leaving the real warnings
to telemetry. I use to set the timer so that cell voltage is 3.8 V –
ready for storage – after the flight, just for convenience and to go easy
on the battery. Telemetry is only a safety add-on in this case because any alarm
could be expected merely from a too cold battery or a bad cell (what even
happened by all means, though).
The cell-voltage warning level should be 3.50 V because that
corresponds to about 25% really (not nominally) remaining charge. Under normal
circumstances, including full-power setting at the end of a flight, there will
be no such warning since the discharge warning comes so early (at 30%
nominal) that the airplane is landed before voltage gets that low. But
in case the battery is actually too cold, or if at least one of it’s cells
is worn out or bad in some other way, or unusually high amperage is drawn during
the flight, this voltage warning will be triggered sooner, already at a quite
moderate state of the discharge counter, in extreme cases even earlier than the
discharge warning. So in any case we didn’t allow for in the discharge
warning level, the cell-voltage warning level might alternatively and
safely prevent underrunning at least the (actual, instantaneous) 20% really
remaining charge limit – if full power is set towards the end
of the flight.
That’s why the concept of a general telemetry setup can be adapted
also to high-performance applications where high power is set all
the time. Actually it’s not an
adaption but rather a reduction: We do without an amperage sensor, which
is useless now because it would monitor only the nominal value of the same
discharge warning level that the cell-voltage sensor is able to
monitor by means of its real value. Its warning level is still set to
3.50 V, meaning about 25% really remaining charge. That ensures that
the airplane can be landed before the 20% really remaining charge limit is
underrun, even in adverse circumstances. In this case the voltage warning
can be the main means of advising the pilot to land because
amperage is high:
High-performance is defined here as short flights at or close to
full power, typically 6 minutes at 7.5C using 75% of the battery’s
capacity. (Very-high-performance – more than 10C on average
and 20C peak, for instance in EDF jets – is no different except that
the voltage warning levels should be lower by at least 0.1 V.) At 7.5C
(or even more) the battery ages quite fast, anyway, so it’s charged to
100% and discharged down to 20% to have acceptable flight times (which are
still short). That is there’s no safety margin left and we’re
not going easy on the battery. We have to put up with a quite short
battery service life as well as noticeable capacity degradation. But
discharging below 20% would accelerate degradation even further and
that is not accepted here.
Usually the throttle timer is used to signal when it’s time to land so
not more than 80% of the capacity is used. However, its setting would have to
be adapted from time to time to the actual degradation or occasionally to the
consequences of low temperature, which both may be even unpredictable so
it’s hard. The same would be true also for an amperage sensor with
discharge counter so both this sensor and the timer are not really convenient.
In all circumstances, the cell-voltage sensor detects the actual,
instantaneous 25% limit regardless of capacity degradation, leaving
again 5% reserve before 20% is reached. In this high-performance case,
though, that means only 24 seconds to land the model.
But at least the sensor helps avoiding deep discharge which would speed up
the degradation even further. So if avoiding overly fast degradation
is intended, such a sensor is useful and easier to set up (once for all to a
given value) than the throttle timer, which is actually needless then.
Even easier, or simpler would be a battery checker that stays in the model
during flight and warns with a loud tone when cell voltage falls below
3.5 V – instead of telemetry, and such a device exists.
It’s a good solution for model airplanes but for model helicopters
(at least scale helicopters)
I would still prefer full telemetry. They are high-performance cases as defined
here in some sense even if they tend to medium performance in another sense.
Anyway, a helicopter’s rotor and motor have to do what is done by an
airplane’s wing. As a result, a helicopter’s amperage draw is quite
steady on average, even if quite different in hover and cruise, and there are
strong fluctuations in maneuvers and when reacting to gusts.
My HIROBO Schweizer 300
for instance draws between 23 and 29 A on average (cruise flight and hover,
respectively) but there are peaks down to 10 A and up to 35 A (or even
more).
That is merely between 3.3C and 4.1C on average and up to 5C peak due to a big
7000 mAh battery and is a case between medium and high performance.
If it had a normal 5000 mAh battery it would be beetween 4.6C and 5.8C on
average and up to 7C peak, what is still not quite high performance as defined
here.
Yet we can be sure that coming below the cell-voltage warning level is noticed
very soon because those peaks occur also towards the end of a flight and last
long enough to draw voltage down and trigger a warning.
Then again, average battery drain is not quite a medium-performance case as
defined here, either.
Yet flight times may be so long that we can go easy on the battery, at least
in case of the big battery.
Then we would want an amperage sensor for an early warning and the throttle
timer even earlier.
Now average battery drain can be quite different between flights, up
to 25% in this case. (With my Senior Telemaster Plus airplane it’s
only 15%.)
So when doing mostly cruise the throttle timer will go off first, when doing
mostly hover the discharge warning may come even before it.
However, we should set a deduction from nominal capacity to allow for aging,
which will be faster and greater than in a medium-performance case so we might
set even 20%.
While the battery is still fresh, the discharge warning would then be issued
"too early" during a flight, which will be relatively short already
due to relatively high C-rate, at least with the smaller battery, so we want
to max it out after all.
But re-setting (lowering) the discharge limit from time to time, in order to
adapt it to the battery’s actual age and capacity, is not easy but rather
inconvenient.
Instead, we could deduct the 20% from the start and set the throttle timer to
a longer time. After all it is really easy to adapt, be it
to the battery’s age or even to the flight regime (more hover or more
cruise).
Now it will usually go off after the discharge warning. If we mess
up and it’s too late we have still the voltage warnings, which are
reliable here after all.
If we do it properly we are alerted by the discharge warning that we have
still some time to fly but should now listen for the throttle timer.
When it goes off there should be ideally 30% of capacity left.
We can now decide to use the next 5% charge to land the heli before reaching
25% remaining (easy on the battery) or fly on with this 5% until the first
voltage warning (3.5 V cell voltage, 25% remaining) is issued and then land
with the next 5% before reaching 20% remaining charge (maxing out flying time).
5% charge means 43 seconds left to hover and land the heli with the bigger
battery and 31 seconds with the smaller one, 52 or 38 seconds, respectively,
if 80% of the approach for landing is cruise flight.
All that leads to a general safety plan devised for helicopters and described
for my ROBAN Bell 429.
It’s actually the complete general telemetry setup originally devised for
low and medium performance airplane cases. But in the case of helicopters we are
sure that the voltage sensor can do its job like in high-performance airplane
cases so it’s no longer just a complement. Both sensors are equally useful
in this case and hence we rely on both of them. Due to the greater variability
of battery drain, the throttle timer is less reliable here but it’s still
a useful complement as it lets us either go easy on the battery or max out
flying time, respectively, if and when possible.
Logged GPS 3D Location Data for Incident Investigation
This article has not been published elsewhere. It's just a
supplement to the previous article and is supposed to show that
a GPS is a useful device in a model airplane that carries data logging
telemetry already. To this end, it comprises a lot of pictures and some
diagrams to illustrate what has been expounded in the previous
article:
In the first place, the GPS had been installed
in my Senior Telemaster Plus
to have in-flight data like speed, altitude, and distance. In this
regard, it was soon mostly superseded by a
barometric (pressure) sensor.
Yet it has been left in place because there is a data logger in
the airplane as well. Both devices pair up to constitute an almost
complete “black box” system for models.
That proved to be useful even in an early case of incident (in October
2016), which could be cleared up completely, and later in a second case
of incident (in September 2018), which was elucidated for the most part.
These two cases are investigated here as well as in the previous article
above.
Technically, the GPS 3D location data (in
GGA format) are logged twice a second
during flight, along with all telemetry sensor data, which are logged
even ten times a second. Later, the complete log is imported in the
LogView program, which generates statistical
(time series) data diagrams as shown above and below.
From this program, the 3D location data are exported in
KML
format and imported in the Google Earth software. There, the flight path
(with ground speed or climb/sink rate or both combined as different colors)
can be visualized from any viewing angle, including from pilot's position,
as shown below. Both programs have perpetuated their names in the
following screen shots.
[Remark: The LogView program is no longer available and supported.
There is a freely available "successor", though, which is
even more versatile and has several telemetry data formats predefined:
DataExplorer.]
Touched a Bushtop
That's what the airplane did at the end of a climb-turn after
take-off when power was scarce and the climb was feeble.
It was a practice flight to test and adjust complicated mutual
flap-aileron mixings as well as the related flap-elevator mixing.
Maybe that's why I just couldn't stop trying again and again and
ignored all warnings in the telemetry voice-output (which was also
cluttered beyond recognition). Anyway, I carried flying traffic
patterns much too far – to a 23rd take-off when
the battery was finally discharged and the ESC's low-voltage power
reduction set in. After the airplane had touched the bushtop, it
tumbled earthwards and bumped sidewards on its main landing gear,
which got crooked – but there was no other damage.
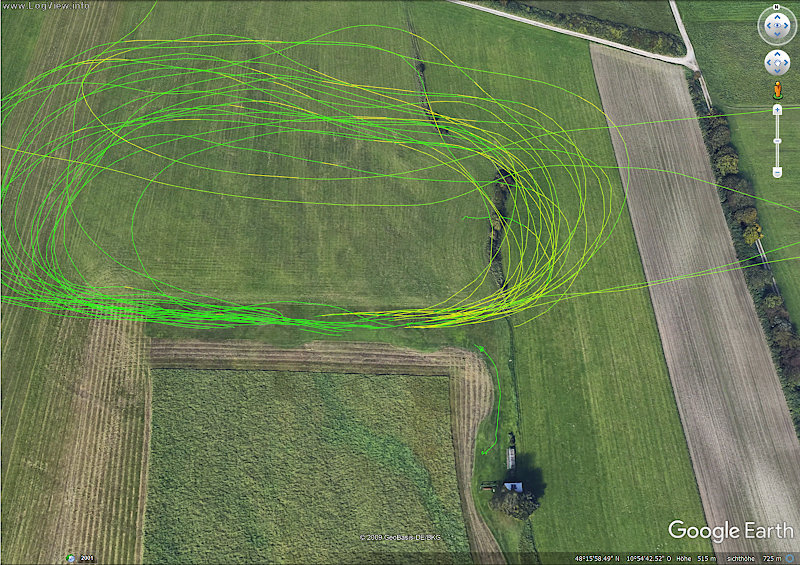
Top view looking north, the runway in the middle of the picture.
Larger…
This is most of the flight's path drawn as a colored line showing
slow (green) to medium (yellow) ground speed (GPS).
As can be tracked in the statistical data diagram in the previous
article above (for a large
diagram click here), it was a flight with many traffic
patterns and some halts on the runway to adjust mixers.
Take-off direction was eastwards (right in the picture). The initial
wide turns as well as most of the (round) traffic-pattern base legs
(left in the picture) are clipped here.
The really interesting thing is the last crosswind leg (from the
eastern end of the runway), which was low and tight and ran through
a bushtop. It is the small (radius) semi-circle, which has no
following downwind leg but ends up in the meadow north of the runway.
The bush is visible here and the model's path is drawn exactly
through its top.
The last take-off belonging to this crosswind leg is hidden in
the pathlines of the preceding traffic patterns.
The picture even shows where the model was trailed from the parking
area (south) to the runway's eastern end, but curiously the line ends
there. Likewise, there are gaps between all traffic pattern lines,
that is between a landing and the next take-off.
Then again, all take-offs and landings seem to be correctly depicted,
at least they look reasonable.
All but one, that is, because one take-off seems to arise from the
ditch running north to south at the runway's eastern end.
This picture shows that even better, but there is yet no explanation
for this single "runaway".
All other take-offs look reasonable, including the last one, which is
visible here.
It's correct that its take-off point is just shy of the ditch behind
the runway. The ESC's low-voltage power reduction had set in even during
the take-off run so I literally had to take the airplane off the runway
in the nick of time.
The following low crosswind turn is well pictured here, including a
crosswind apex and a slightly descending part to the bushtop. Obviously,
power had been reduced too much already to maintain even level flight.
From the bushtop, the flight path runs steeper to the ground because
the model had been retarded by the bush's vertical top twigs and I had
cut power completely.
The "hump" at the end of the flight path might come from me
picking up the model, but that is not clear and not relevant, either.
It is crucial that the last take-off and the incident as such are shown
quite correctly. The "runaway" take-off is petty because it
didn't lead to an incident. And it doesn't matter that coasting down after
landings as well as take-off runs are not shown at all.
Only one thing is questionable: The flight path as shown is running
through the bush while the model actually just brushed the
bushtop. If it would have been lower – as shown here –
it would have stuck in the bush. I don't think the bush is
"overinflated" in Google Earth, though.
There was still no barometric altimeter in the airplane to compare to
GPS altitude shown here, and both altimeters are not that precise, either.
But yet we should have a look at the third statistical data diagram in the
previous article above (and
make it larger). It shows battery voltage (magenta), amperage
(red), and charge (green), as well as the airplane’s altitude (blue).
The altitude line is running noticeably below zero while the airplane is on
the ground, evident during the landing/take-off at the left side and in the
center of the diagram.
That holds also for the second diagram in the article above, which shows the
last seven traffic patterns as well as the incident.
This diagram, which shows two GPS altitudes during the whole flight, depicts
values well below zero for all ground runs. That explains why there is no
flight path line on the ground – it's actually underground and hence
clipped in the picture. That might even explain the "runaway" as
a take-off where GPS altitude was extremely off (negative). It might have
been the take-off at about 20:00 after a pause at the runway (to adjust mixers).
It is -10 meters off while most other take-offs are about -5 meters
off (give or take).
After the incident, altitude is still -4 meters but virtually doesn't
drift for about 55 seconds until telemetry is switched off. When telemetry
was switched on, altitude was exactly zero for about half a minute, probably
while the GPS was searching for satellites. Then it starts drifting mostly
to negative but jumps back to -1 meter when the airplane is trailed
to the runway.
Since there was yet no barometric sensor in the airplane, GPS altitude above
ground level (at telemetry run-up) has been used here instead. Additionally,
the 3D location data include the GPS antenna altitude above mean sea level.
The former has one meter resolution, which is why the blue line is stepped
while the brown line with its nominal millimeter resolution is smooth or
serrated, respectively. Otherwise both lines are the same.
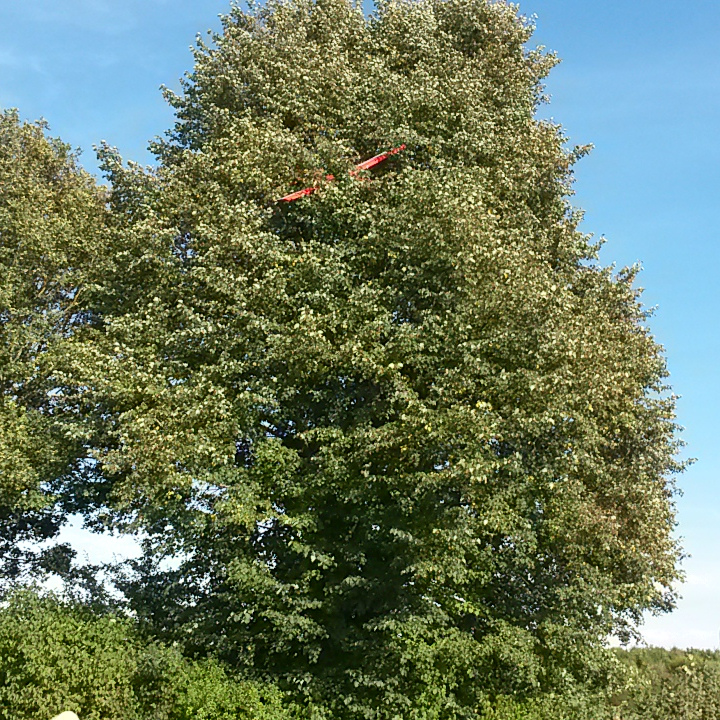
Sunk into a Treetop
That's what the airplane did at the end of an actually successful flight.
When the battery discharge warning was announced I wanted to land the model
straight away and eventually even set full flaps for a fast descent. But I
grossly underestimated the wind and, for a moment, just watched in wonder how
the airplane was making leeway and got behind the notorious line of trees in
the east of the field. When I finally opened up, there was hardly any power
and I saw the airplane get just over a tree and then sink almost vertically
into the near side of its crown – obviously by combined effort of sink
speed and a 15 km/h gust of headwind. As it turned out later, one cell
of the drive battery had gone kaput – as usual at the wrong moment.
As by a miracle, the model stayed completely undamaged – that's why
I call it a tree-landing and don't use the word crash.
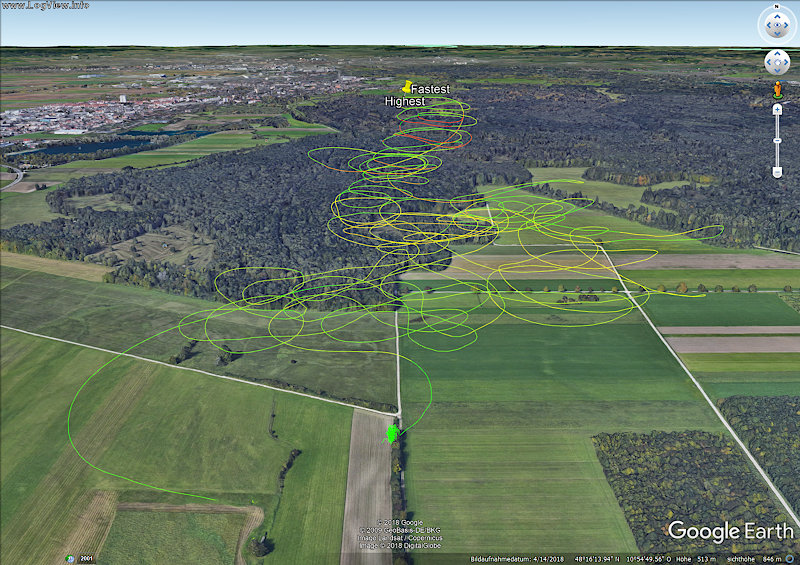
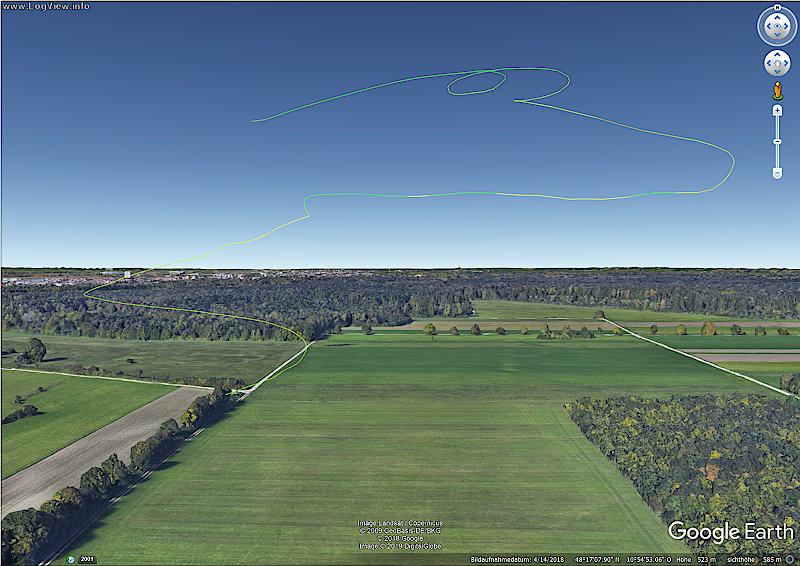
The whole flight, looking north over the line of trees in
the east of the club's flying field, which is bottom left.
Larger…
This is the whole flight's path, with GPS 3D-speed (ground speed and vertical
speed combined) color-coded from green (slow) to red (fast). As can be tracked
in the statistical data diagram in the previous article above, it was a typical flight in strong thermal conditions.
After a 45 second climb to 150 meters, the airplane loitered at low
cruise power for 2½ minutes – in quest of thermals. A short
downdraft boded a strong thermal, which was used for nearly 5 minutes,
eventually even at idle power. At 260 meters, the flight's highest point,
an accordingly strong downdraft followed, which had to be attenuated by re-setting
cruise power after just 10 seconds. About 4 minutes later, power was
even increased to level off at 75 meters. After loitering there for
3 minutes, another thermal was catched and used for 3 minutes. Now
the battery discharge warning was announced at 170 meters and power
was cut after almost 18 minutes flight time.
While the loitering parts look rather bewildering, the two thermal climbs
give the impression of being clearly discernible by their spiraling pattern.
There is one important variation, though: their inclination. While the first
spiral is moderately inclined, the second one is virtually blown by the wind.
I see that as an indication that the westerly wind had significantly freshened
between the two thermals – a fact that dawned on me only too late when
the airplane got leeward (eastwards) behind the line of trees (centered in
the picture).
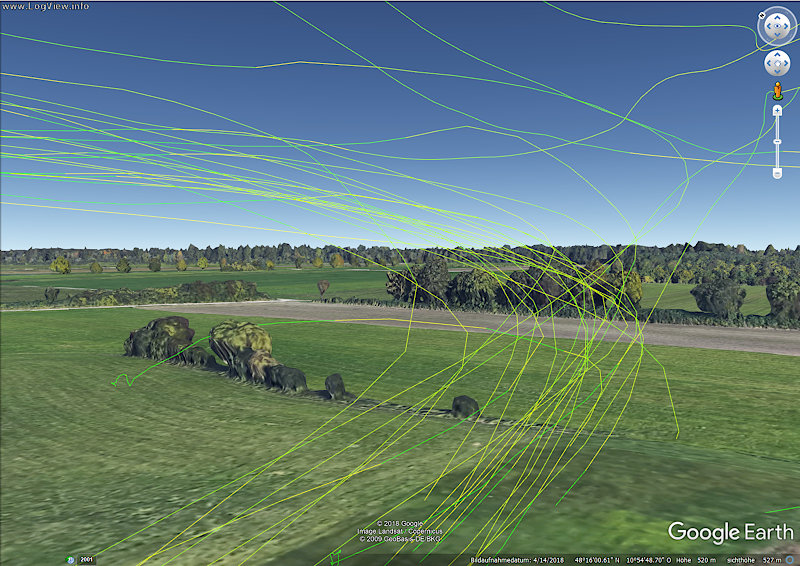
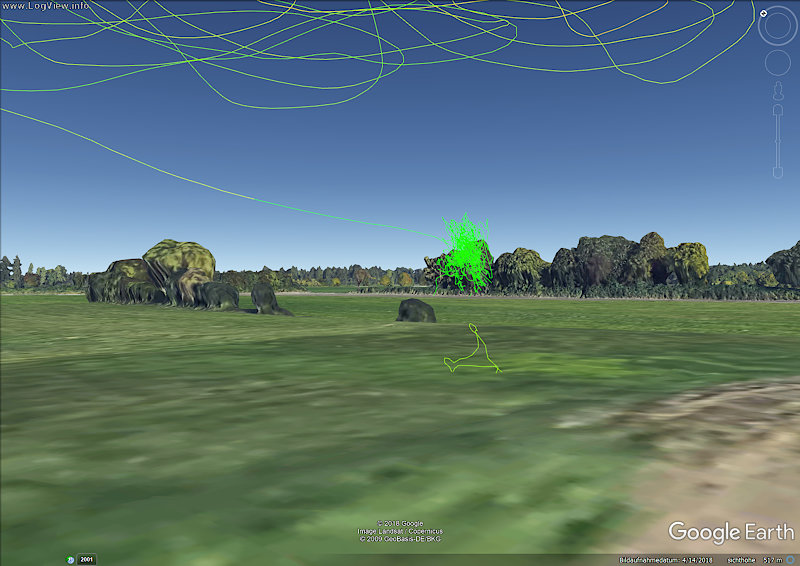
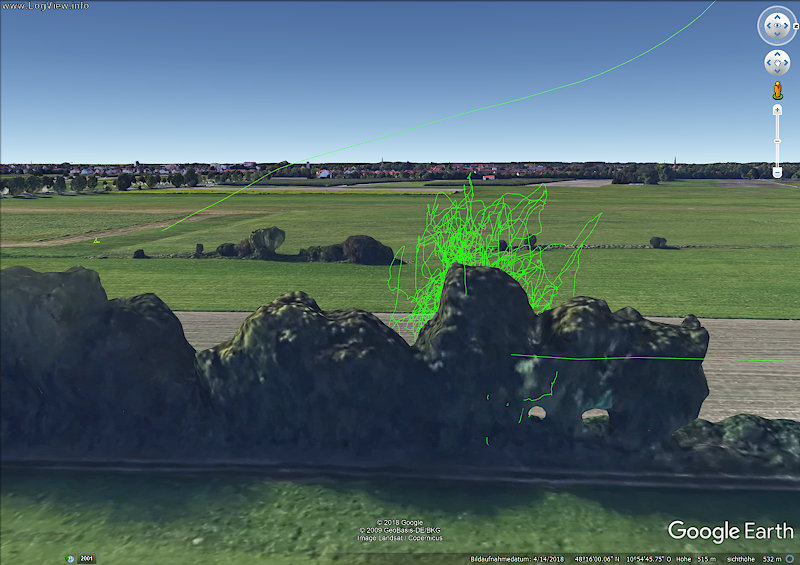
Pilot's view of the tree-landing, looking northeast.
Larger…
In a way, the weird tangle on the tree has to do with the wind. It
represents the time when the model was in the tree's twigs (see photo
below) for nearly four hours and was heftily shaken by the gusty wind.
Obviously, the GPS needs standstill or a vectored movement to calculate
an exact position. If it's raggedly tossed about, it can't find a
position to converge to. At least I have no other explanation.
The "triangle" in the foreground is similar. It's where I put
the model on the runway for the checks before take-off. Telemetry was
re-started and there was actually no movement.
Anyway, while the GPS is amazingly precise for most of the flight, there
are moments when it acts up.
In the flight's final part its path seems to be flatter, perhaps
because I unconsciously flattened it. That may be true, but the different
flight speeds (yellow changing to a "slow" green) are mostly due
to the wind. The airplane made an upwind turn into strong wind and that's
why it got slower over ground. Besides, this view from southwest shows
that the final turn ended not upwind (westwards) but just southwestwards,
so there is no way to see the path's slope correctly.
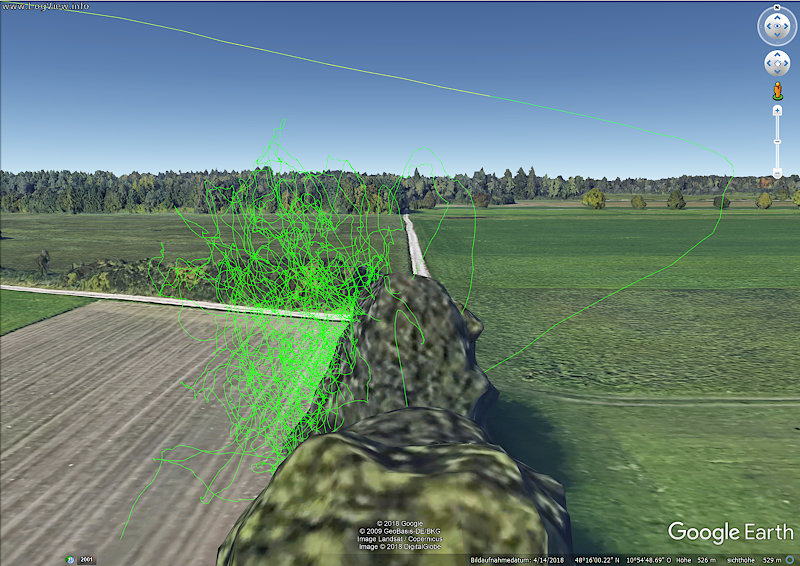
The flight's final part, from reaching the last peak altitude and
cutting power to the tree-landing.
Larger…
In this view, the turn's final part looks even considerably steeper than
the downwind leg before. That's partly because sink rate is higher in a
turn, especially with flaps down. But that's mostly just what a downwind
and an upwind leg look like – flatter and steeper, respectively.
The upwind leg before the last downwind leg is about as steep as the
"final approach". The kink in the flight path is where I set
full flaps for a fast descent because so far the airplane hadn't lost
altitude even up wind, perhaps due to thermal influence. Despite the strong
wind the airplane got to a good position abeam of the runway's threshold.
Maybe that's why I started a downwind leg then, or by force of habit
– I have no idea.
Actually, the wind should make eastward parts of the flight path faster
over ground and thus more yellow, while the westward parts should be slower
and thus more green. That is not clearly shown in the picture, though, perhaps
because the speed differences are not that big.
Rather the different flight speed colors stem from circles not flown correctly,
that is with too little up-elevator and then too much as reactive response,
or from a really fast downwind dive. Anyway, it seems that the airplane
got slower – for whatever reason – from the point on when I
realized that it was behind the line of trees and too low already.
Cell voltage (cyan), battery voltage (magenta), amperage (brown),
barometric altitude (pink), barometric air speed (red), GPS
ground speed (blue), variometer (green).
Larger…
This diagram is similar to the second statistical data diagram in the
previous article above, especially
in that it shows the last thermal circles, the turn back to the field, the
fast descent, and the tree-landing. It does not show remaining battery charge
but instead air speed, (GPS) ground speed (both in km/h), and the variometer
(climb/sink rate in m/s). The two speeds are most interesting here; the other
values are shown to have the context, and the variometer is just for information.
There are several fluctuations in both speed lines. In the diagram's left
part are two synchronous "waves" (at 18:37 and 18:47, respectively)
where (red) air speed is considerably higher than (blue) ground speed (by
7 km/h or even 15 km/h, respectively). The opposed (pink) altitude
fluctuations indicate that this is an upwind part of the flight that was
flown in waves by me. Even though altitude is overall increasing, this is
not the first part of the path shown in the previous picture, which goes
upwards in downwind direction.
Rather this part corresponds to the following, gradient part of the (pink)
altitude line (from about 18:56 to 19:08) in the diagram. Both speed lines
have two peaks in this part (at 18:56 and 19:06, respectively) but now (blue)
ground speed is considerably higher than (red) air speed (by up to 18 km/h).
So this is a downwind part that has been flown in waves as well. Obviously,
the altitude fluctuations are exaggerated in the diagram because they are
compressed over the time axis. The flight path over ground hardly shows
any altitude fluctuations.
Most of the speed fluctuations are not synchronous but opposed. That indicates
turns or even circles with their upwind (air speed higher than ground speed)
and downwind (air speed lower than ground speed) parts as well as crosswind
points (speeds equal).
For instance, the following two (pink) altitude peaks (at 19:08 and 19:19,
respectively) indicate the two staggered circles shown in the flight path
above. Power (amperage, brown) was cut (at 19:18) right after the first
circle and the fast descent started even in the second circle (at 19:25).
The horizontal part (from 19:36 to 20:03) is actually a wide right turn
from upwind to crosswind, overlaid by altitude or sink rate fluctuations,
respectively. There are always corresponding speed fluctuations and all
these fluctuations continue for the rest of the flight.
The last high (blue) ground speed peak (at 20:41) indicates the last, fast
downwind leg. In the crosswind part of the wide final turn (at about 20:45),
(red) air speed is higher than before and after, and correspondingly sink
rate (green) is higher. Still air speed is rather constant compared to ground
speed, which is much lower in the final upwind leg (from about 20:50 to 21:01),
actually being a diagonal leg to southwest in westerly wind and ending up in
the tree.
In the last four seconds of the flight, (blue) ground speed virtually drops
to zero while air speed drops to zero even faster but after one second jumps
up again to a sharp 18 km/h peak, just to drop to zero again.
That's not only hard to make out in the diagram, it's also hard to explain.
The last peak in amperage is synchronous so the air speed peak is possibly
an acceleration achieved with the rest of power the battery could yield.
That ground speed didn't peak anymore is perhaps due to the fact that the
airplane got over the tree top and was hit by the strong wind, maybe even
a gust, just in this moment.
This diagram demonstrates how GPS heading can help connecting a time-series
diagram to a Google Earth flight path picture.
At about 18:20 (left) the (blue) heading line starts at 335° (north-northwest),
then it decreases rapidly (left turn), rolls over from 0° to 360° (north),
and goes down to 220° (southwest) at 18:34. That was more than a full circle.
Then a nearly straight flight ends at 18:41 when a right turn starts (increasing
heading) that is shortly interrupted at 18:48 and continued at 18:51. It rolls
over at 18:56 and ends at 19:01 where a straight flight at heading 120°
(eastsoutheast) starts.
This part of the flight is not visible in the detail flight path picture above.
The following 120° straight flight is the first visible part and it ends
at 19:05 where a left turn begins. This rolls over at 19:10, comes full-circle
to 120° at 19:17 (after 12 seconds), rolls over again at 19:21, comes
full-circle again at 19:29 (after another 12 seconds), rolls over again at
19:35, and stops at 19:39 (after 10 seconds) at 260° heading, 140°
before coming full-circle again. This are the (about) two and a half visible
circles which are blown eastwards by the wind and which are inclined northwards,
as indicated by the altitude fluctuations and shown in the flight path picture.
Just after coming full-circle for the first time, power had been cut at 19:18
and a steep and fast descent started, shown as yellow and even red line in the
picture above. When the circling stopped, the airplane was leveled off and a
long and wide right turn followed.
At 20:06 and just at northern heading, the turn was reversed to a left turn
into the wind and full flaps were set (the "kink" in the flight path).
That made for a quite steep descent maintained until the airplane landed in the
tree.
The initial left turn was interrupted by a quarter right turn and continued
until 20:40 to an easterly heading (75°). The "final approach" right
turn ends at 20:58 in the tree, where the heading line plummets from about
230° to zero, that is it ends here because motion stopped.
Back view of the tree-landing, looking west, the runway with take-off
and climb in the background.
Larger…
The flight's start and end in one picture, looking west into the wind. The
weird "triangle" on the runway is where I put the model down for
the checks before take-off. No take-off run is visible but the point of
take-off, just as in the previous section
(about the first incident). Their positions look correct, like it was in
reality. It just seems that the flight path is too low so the take-off
run is "underground" and hence not visible.
The "final approach" to the tree looks perfectly correct as well
when it comes to the path over ground. Even the tree's shape and its height
look correct, but the airplane's hitting point in the tree's crown is
definitely too low, as evidenced by the photos below. The model just didn't
fly into the tree's lee side but flew a bit over its top,
just to sink into the windward side of its crown. Sounds
crazy but that's what really happened.
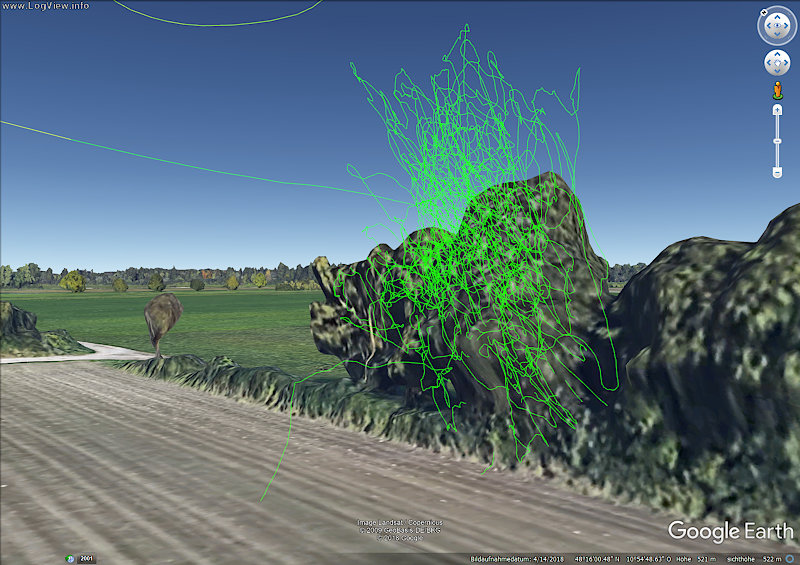
Side view of the tree-landing, looking north exactly
over the line of trees.
Larger…
In this view, the "final approach" is well visible including
its ending far too low in the tree's crown. Probably, the whole approach
is depicted too low but that's noticeable only in comparison to the tree.
By the way, the shade of the trees looks even correct, that is how it is
in early afternoon. That must be a happenstance, though, since there is
no time information in the location data.
The weird "tangle" at the tree's left side looks even correct
as well. It's obviously caused by the shaking experienced by the model during
the four hours spent in the tree. Perhaps the gusty wind moved it in all
directions, and the quite small movements are grossly exaggerated by the GPS.
Anyway, the center of all these movements seems to be the place in the tree's
crown where the model actually rested. At least all movements are on the tree's
windward side (left in the picture).
Oblique front view of the tree-landing, looking northeast.
Larger…
This picture shows even better that the tangle's center seems to be high
in the tree's crown where the model actually rested. Only when it was
retrieved, the path of motion got too low again, at about the same height
as the hitting point at the other side. The green line finally goes away
from the tree, horizontally to the left, and then down to the ground where
it ends. Actually, I got the model in my hands, about 1.5 meters
above ground level, but GPS antenna altitude shows it -6 meters
below ground level at this time. Most likely, the "underground"
part of the pathline is just clipped in Google Earth.
The airplane was retrieved from the tree by means of an articulated
boom lift. (Big thanks to the club-mate who did that for me!)
This picture shows especially well that there is a reasonable GPS pathline
as soon as there is some vectored and steady movement; it's just too low.
Once the club mate held the model in his hands he swiveled the boom
lift away from the tree and then down to the ground.
There, he handed the model over to me and I carried it back to the parking
area, where I switched off the receiver with telemetry.
What is shown as a field in this picture was a meadow at the time
of incident (and has been made a field again thereafter).
Actual photo of the model in the tree, shot from northwest
(my white hair left bottom);
comparison picture shot from a similar viewing angle.
My driving instructor said (as far back as 50 years ago):
“You can't even think as silly as it comes.” He was right.
I could hardly believe what I saw: an airplane in the windward side of
a tree's crown, pointing outwards into the wind.
Conveniently, it wasn't blown out of the tree so it wasn't in danger of
plunging down, and it wasn't blown further into the tree, either.
The picture has been shot after the model had spent nearly four hours
in the tree, where it had been shaken by the gusty wind all the time.
(Many thanks also to the other club-mate who shot photos with his
smartphone!)
Anyway, that shows that I wasn't dreaming when I saw the airplane scarcely
getting over the tree's top (or rather close beside it), then lowering
its nose, and finally sinking into the tree's windward side. After all,
I found out only later that it had lost power and therefore started a
steep descent (due to full flaps), which was made nearly vertical
by the strong headwind.
The tree without foliage (and without any model), shot from southwest
half a year later.
The tree without foliage is just visual proof of the fact that the airplane
did not fly through it. You can see as well that all twigs in the
crown's upper part are pointing slanted upwards – and are just thin
twigs, not thicker branches.
In the first place, this explains why there was not the slightest damage
on the airplane. In turn, this required that the model – nose first
– slowly sunk into the tree's crown where it was literally rescued
by these resilient twigs.
It rested with its wing's and stab's leading edges (sheeted D-tubes) on
the twigs and didn't even slip further into the crown.
Every attempt to push it out of the crown by means of a long rod (as usual
in such cases) would have made for damage – by the rod and by the
following plunge.
So the only way to retrieve it undamaged was to go up to it with an
articulated boom lift, grasp it under its sheeted wing roots, and heave
it out of the twigs.
After giving evidence of the fact that the airplane did not fly
into or even through the tree's crown, this diagram is an attempt to shed
some light upon the problem of false GPS altitude values. To this end, it
contrasts GPS antenna altitude with barometric (pressure) altitude. The
former is shown in the Google Earth flight path pictures while the latter
had been just displayed and logged during flight. The two respective axes
have been equally scaled and offset so that both lines begin at the same
level, which is – by definition – ground level for the former
and zero for the latter.
The time axis covers the whole logging time, about 4 hours and 11 minutes.
It starts with 1 minute and 40 seconds preparation for take-off till 1:40.
The actual flight lasted 19 minutes and 20 seconds till 21:00 when the
airplane landed in the tree. Then it spent nearly 4 hours in the tree
(3 hours and 45 minutes till about 4:06:00) until it was retrieved
and carried to the parking area (for about 4 minutes and 30 seconds)
where telemetry was switched off (at 4:10:32). So 90% of this time are taken
up by the stay in the tree, which is the most prominent center part in the
diagram.
The jaggy (brown) GPS antenna altitude line corresponds to the weird
"tangle" on the tree in the Google Earth pictures. It varies
both short-waved and long-waved over time, but in the pictures above
it seems to be fairly correct on average. Still, in the end it seems
to be too low just like at the time of the tree landing. Anyway, when
the airplane is retrieved it goes from about +5 meters to
-6 meters below ground level. And even though it turns
upward during the walk to the parking area it's still -3 meters
in the end. The 8 meters difference between +5 and -3 meters
could be even the correct difference between the level in the tree
and ground level.
The (pink) barometric altitude line is not jaggy but stepped, what is
simply due to the 1 meter sensor resolution. At the time of the
tree landing this altitude is +13 meters, but during the
3 hours and 45 minutes stay in the tree it slopes upwards to
+24 meters, perhaps due to an air pressure drop. When the airplane
is finally retrieved, the line steps down by about 7 meters to
+17 meters above ground level. The step could be even
correct (compare photo above), but final altitude should be actually
close to zero and subtracting the 11 meters drift would still give
+6 meters above ground level. If there was an air pressure
drop even during the flight, though, the barometric altitude could be
actually correct in the end. After all, only 1 hPa drop would mean
even 8 meters more. Anyway, at least the line stays level during
the walk to the parking area.
GPS antenna altitude (brown) and barometric altitude (pink) during
flight as well as short times before and after; cell voltage
(cyan) and battery voltage (magenta) for orientation.
Larger…
Since comparing both altitudes over the whole time was not very insightful,
here they are compared over the actual flight including its prelude and
postlude. Most striking is that barometric altitude is lower than GPS
altitude for most of the flight, but it creeps up on it and finally it's
even higher.
The previous diagram suggests that there was an air pressure drop, which
was more pronounced in the first half of the time and then degressive. At
least that would explain why barometric altitude picks up this much during
the actual flight.
According to the timestamps in the smartphone pictures, the model was
retrieved and switched off at 17:00 (5pm) so it had been switched on
at about 12:50 (ten minutes to 1pm). In this time a nearby
weather station recorded an air pressure drop from
969.1 hPa to 967.8 hPa (see red line in the
chart).
This 1.3 hPa drop is equivalent to a 10.4 meters rise of
barometric altitude, what is not even equal to the 11 meters drift
after the flight, and there must have been 6 meters drift
even during the flight.
The air pressure line in the weather chart hasn't the same curve shape
as the barometric altitude line, either.
At least the 10.4 meters drift due to air pressure change are for
sure and amount to even 60% of the 17 meters excess altitude at the
end of the whole time.
There could have been a temperature drift as well; after all there was a
1.7°C rise from 26.6°C to 28.3°C at the weather station (see
blue line in the
chart).
Or the sensor could have been warm from sunshine before takeoff and cooled
down during the flight.
Whatever, I have no idea how temperature could affect barometric altitude.
It's even possible that the pressure sensor has some
hysteresis, but again I have no idea.
It seems that 6.6 meters, 40% of the excess altitude, will remain
unexplained.
Still there is another striking aspect: At take-off and "landing",
barometric pressure drops noticeably for a short time.
That is most pronounced during the take-off run when the airplane gets
faster but is still on the ground. After take-off, barometric altitude
rises parallel to GPS altitude but offset by the prior drop.
Before the tree landing, altitude drop is natural but it is shortly halted
when air speed drops to zero. Synchronous to the following short peak of
air speed, altitude drops again but goes finally up immediately thereafter.
It looks like barometric altitude is interrelated with air speed.
GPS antenna altitude (brown), barometric altitude (pink), and airspeed (red)
during the last part of the flight, cell voltage (cyan), battery voltage
(magenta), and amperage (brown) for orientation.
Larger…
The speed-to-altitude interrelation is more easily seen in this detail
diagram showing the flight's final 162 seconds.
There is no single part of both altitude lines where they are level.
Even if altitude is constant on average there are always some fluctuations.
Yet barometric altitude differs from GPS altitude not only by the initial
drop, or shift for that matter.
If air speed is higher the difference is bigger and vice versa.
That is not always true, though. We can't just assume that GPS altitude
is always correct. We already know that it drifts as well and that it
has pronounced fluctuations when the airplane is not in continuous
motion. Now we have to expect some fluctuations in flight as well.
Yet the connection between high airspeed and too low barometric
altitude seems to be obvious, especially during the take-off run.
And then there must be a connection during the rest of the flight
as well, at least to some noticeable extent.
Aberrated from Truth
That's what the GPS obviously does all the time during flight, that is
the calculated altitude is sometimes higher but mostly lower than the
airplane's true altitude. That holds for the "antenna altitude"
(AMSL) as well as the indicated
altitude (AGL), which is set to
zero when telemetry including the GPS is powered up. Immediately after
calibration (when enough satellites are found) it starts drifting.
This is visible in parts of flights where the airplane was close to the
ground or even on the ground like on the runway. Google Earth pictures
make it especially obvious then in that the flight's pathline is actually
running underground and is clipped therefore.
The statistical data diagrams show negative indicated altitudes and
corresponding antenna altitudes lower than the initial position.
But there must be variations and drift also in the other (higher) parts
of a flight. There is no strict evidence for this but comparisons with
barometric altitude suggest it.
The GPS device sends 3D location data records to the telemetry sensor bus
(MSB). They are formatted as
GGA sentences conforming to the
NMEA
definition. Obviously, it specifies mandatory as well as optional
data fields. In this case, only the basic location data are present
in the messages, which are logged twice a second. Maybe they chose
to keep the record length to a minimum in order to reduce bus load.
However, only minimum data are available for later analysis in the
course of incident investigation:
This is a sample record from the second flight analyzed above.
It starts with the tag ($GPGGA) but omits the time of
position fix (between the following two commas). Northern latitude
(4826.77975,N) and eastern longitude (01091.34132,E)
as well as altitude in meters (679.423,M) are the actual
content of the message. The last field (*0E) is a checksum
and all other fields are void.
Especially the omission of
"geoid separation" could be
significant in our case. The source linked above tells about the
GGA sentence: “If the height of geoid is
missing then the altitude should be suspect.” I couldn't say
it any better since the logged data look really suspect, regardless
of the reason why.
The source also tells: “This is the only sentence that reports
altitude.” So this is the correct and only type of sentence to
have 3D (not only 2D) location data and omitting geoid height is sort
of a "flaw".
The time of position fix is missing as well, and that is another
"flaw". There is no way to literally synchronize Google
Earth flight path pictures and LogView data diagrams. The only
timing information available is the cadence of ten telemetry records
per second, which is used to include a timing field in each data
record (formatted as seconds.hundredths). It is counted as relative
time from zero on and shown on a LogView diagram's horizontal axis.
Hence, fairly connecting a three-dimensional flight path with a
time-linear data diagram is possible only by including GPS heading
(and maybe altitude) data in the diagram, what requires logging it
during flight as well.
Google Earth would need absolute time and date timestamps in the
imported KML records. While LogView calculates horizontal and vertical
speeds for color-coding of the flight path line, it does not even
include the second-count, which is shown on the diagram time-axes,
in the exported KML records. Google Earth could at least show this
timeline on the flight path line. If it had the full date and time
of day, it could (technically) even show correct tree shades according
to daytime and season (but I don't know if it actually could).
By the way, this is all the same with the "new" version 2
GPS by Multiplex. They just gave it better hardware, that is a
multidirectional internal antenna and a new GPS processor. The
displayed values and the logged records are exactly the same as
from version 1.
A barometric sensor for altitude and air speed is not better than
a GPS, either. Rather it has its own problems and aberrations, which
seem to be even bigger than those of a GPS. Drift due to changes in air
pressure and temperature is not one of them under normal conditions,
that is with usual flight times of about 20 minutes.
But somehow static pressure (for altitude) rises as well when dynamic
pressure (for speed) rises. That makes for lower indicated altitudes
than in standstill on the ground and generally for altitudes the lower
the higher air speed is.
Possibly that comes from mounting the sensor's pitot-static tube under
the wing, but there's no better place for it on my Senior Telemaster
Plus.
And barometric data can't be used to generate location data for Google
Earth, anyway.
Was of Some Help
That's what the GPS was for me when I investigated ill-fated flights,
or incidents for that matter, so here are my conclusions:
Does a GPS help investigating ill-fated flights and incidents?
Sure it does, especially because it allows to show intuitive three-dimensional
flight path pictures from any viewing angle. That's a valuable complement
to more abstract statistical data (time series) diagrams and helps
interpret them.
Is the GPS accurate enough for this purpose?
Accuracy of the flight path over ground is beyond my expectations. Just
flight altitude is not quite as accurate. It fluctuates and drifts by a
few meters but is still good enough to show a flight path that makes
sense if seen with due care.
Would a barometric altimeter be a substitute?
Surely not because it fluctuates and drifts even more, just differently.
Then again, to have both (complementing) wouldn't hurt, either. Sometimes
it's value is better than the GPS's, and then it's the other way around.
Is a GPS really needed to clear up how incidents occured?
Of course I would try to clear up an incident even if I had no logged
GPS data – in a pinch. It would be much harder, though. Then I
would regret to have denied myself a GPS, and that's why I have one.
It would be easier to do without a GPS if there would be a way to log
servo movements. Especially the power settings (on the ESC’s
channel) would be badly needed to clear up doubts about what really
happened, sometimes elevator movements as well. There is just no way.
Of course, I have a GPS and a data logger only in my big, complex,
and expensive models; otherwise it would be overkill.
Positive and Negative G-Load in Loops
This article was actually a
post in a thread in the Aerodynamics forum at
RC Universe (in late September 2020). It's supposed to show
an unusual application of telemetry but again with a data logger.
Unusual is the kind of sensor, a G-rate sensor, and that no data
is transmitted to the ground. Sensors and data logger with an own
battery are a stand-alone system in the model. The term telemetry
is not quite correct in this case. The forum post has been turned
into a full-blown article here:
In 2019 I had a conversation (actually a smalltalk) with a clubmate who
is skeptical towards telemetry. He doesn't see much benefit and said a
G-rate sensor is even the height of uselessness. I couldn't object anything
since telemetry's usefulness is limited also for me and I just like to use
it as a technical toy. And I didn't see any application for a G-rate sensor
either. Then, in July 2020, came the
thread at RC Universe about an airplane that
flicked (snapped) upright at the top of a loop. In the discussion, most
of the participants didn't seem to realize that there is negative G at
a loop's top, that is the airplane is inverted borne by its wings and
still needs up elevator to fly the loop's round shape. Now there was
an application for a G-rate sensor: measure the G-load during
loops to show it to the incredulous.
So the G-load during loops was measured just for the fun of it. Those
were not exactly precision loops and “normal” in that they
were flown not especially slow and wide and not especially fast and tight
either. It turned out that close to the top about -½ G (inverted)
is acting on the airplane so half of its weight is borne by its wings and
the other half by centrifugal force, as it were. Faster and tighter would
mean more centrifugal force and less inverted wing lift, slower and wider
vice versa. A video shows the loops to compare them to what your loops
look like, a diagram shows the varying G-load during the loops, and photos
show the equipment used to measure the data.
Video
A clubmate manned the camera and shot a video showing the biplane like a
speck in the sky. Unfortunately, there was a lot of dust on the camera's
sensor so there are more specks in the sky. Since they are static it's
still easy to see the moving airplane doing one loop after the other.
And it helps to watch the video in a bigger format on YouTube.
The video is actually a cut-out sequence of three consecutive complete loops,
followed by two “aborted” loops. The latter are just meant to show
that the airplane goes up in a straight line when the elevator is released to
neutral in the loop's second quarter. The former are the exemplary, even if
not perfectly round and equal loops used to show the typical G-load variation.
Diagram
In the following diagram, the measured data for the first three loops are
plotted over 29 seconds time, the average time per loop being 9 seconds.
That is too much and doesn't match the timing in the video where the loops look
like in reality and take 5 seconds on average. The timing has been done by
the data logger and probably it's not calibrated. That's simply wrong scaling,
though, and doesn't affect the interpretation of the measured data.
Altitude (green) goes up and then down like waves, the loops being not really
round and with different top and bottom altitudes. Climb rate (red) goes up in
a loop's first quarter and down in the second, below zero in the third, and back
to zero in the fourth. Altitude and climb/sink rate seem not quite synchronous.
That may be the delay in calculating the climb/sink rate from altitude change,
but I don't know. The pressure sensor has 1 m resolution and that's why
both lines are stepped.
Altitude [m] green, climb/sink rate [m/s] red, G-rate blue
(+10 is 1 G in upright flight, 0 is weightless, -5 is 1/2 G inverted).
Larger…
G-rate (blue) is scaled in tenths here, +10 being +1 G in upright level
flight, the airplane's weight on its wings. A horizontal line is drawn here
as a reference. The sensor has fine resolution so there are no visible steps
in the line. There's a lot of fluctuations, though, which may be seen as kind
of “rough air”. There's a gyro system in the airplane that evens
out it's motions. For sure I didn't dither on the sticks.
Anyway, the G value goes down to -5 (-½ G) in every loop's second
quarter, meaning the airplane has to crest the loop-top inverted on its wings.
When flaring to upright level flight in the loops' fourth quarter I pulled up
to +4 or even +6 G.
Implementation
Because it was so interesting now, I specially purchased the G-rate sensor.
A barometric sensor, a data logger, and a battery were picked from different
models. The three little boxes were Velcroed under an aerobatic biplane's hatch.
The red thingy on the battery is a BID (Battery IDentification) chip used by
the charger to know the correct parameters; it's not relevant here.
That all fit snugly in the battery compartment. The hatch was just flush with
the fuselage, the boxes jammed between the hatch and the drive battery. The small
2S 450mAh battery was put beside the 4S 2600mAh drive battery and connected to
the plus and ground strands of the sensor bus cable using an adapter. The data
logger had been set to work as the bus master, peeking for sensor data. Now
there was a stand-alone measuring and logging system in the airplane.
Ram air pressure from the opening under the spinner is in the whole fuselage
and may distort the barometric measurements (altitude from air pressure and
variometer calculated as altitude change rate). This pressure varies with
flight speed, which varies a lot during the loops, but obviously that didn't
detract from the above diagram's general correctness.
G-rate sensor in the middle, altimeter/variometer below, data logger
above, small 2S battery left.
Again the hatch with sensors and the biplane.
3D capable biplane with huge controls.
Electric foamie, wingspan 41 in, weight 4 lb, thrust/weight about 1.
Conclusions
To be sure: Telemetry is not really necessary but a nice technical toy.
And sometimes it's even useful – if we have a use case
like investigating an incident (two cases above), demonstrating something
unobvious (this case), or measuring in some way interesting but otherwise
unknown parameters (for instance longitudinal accelerations or G-loads,
respectively, what the G-rate sensor can do, too).
In these cases, the data logger is the telemetry system's key
element. It's in the aircraft so data are logged ten times a second
(compared to once a second if it's in the transmitter). Then, it can
act as the bus master, making for a stand-alone system, if there's a
receiver without sensor bus. However, this system's technical value
consists in producing time-series diagrams of several correlated
parameters – if you have a use for them, of course.